pacman::p_load(ggiraph, plotly,
patchwork, DT, tidyverse) Hands-on 3
Programming Interactive Data Visualisation
exam_data <- read_csv("../data/Exam_data.csv")Rows: 322 Columns: 7
── Column specification ────────────────────────────────────────────────────────
Delimiter: ","
chr (4): ID, CLASS, GENDER, RACE
dbl (3): ENGLISH, MATHS, SCIENCE
ℹ Use `spec()` to retrieve the full column specification for this data.
ℹ Specify the column types or set `show_col_types = FALSE` to quiet this message.p <- ggplot(data=exam_data,
aes(x = MATHS)) +
geom_dotplot_interactive(
aes(tooltip = ID),
stackgroups = TRUE,
binwidth = 1,
method = "histodot") +
scale_y_continuous(NULL,
breaks = NULL)
girafe(
ggobj = p,
width_svg = 6,
height_svg = 6*0.618
)exam_data$tooltip <- c(paste0(
"Name = ", exam_data$ID,
"\n Class = ", exam_data$CLASS))
p <- ggplot(data=exam_data,
aes(x = MATHS)) +
geom_dotplot_interactive(
aes(tooltip = exam_data$tooltip),
stackgroups = TRUE,
binwidth = 1,
method = "histodot") +
scale_y_continuous(NULL,
breaks = NULL)
girafe(
ggobj = p,
width_svg = 8,
height_svg = 8*0.618
)tooltip <- function(y, ymax, accuracy = .01) {
mean <- scales::number(y, accuracy = accuracy)
sem <- scales::number(ymax - y, accuracy = accuracy)
paste("Mean maths scores:", mean, "+/-", sem)
}
gg_point <- ggplot(data=exam_data,
aes(x = RACE),
) +
stat_summary(aes(y = MATHS,
tooltip = after_stat(
tooltip(y, ymax))),
fun.data = "mean_se",
geom = GeomInteractiveCol,
fill = "light blue"
) +
stat_summary(aes(y = MATHS),
fun.data = mean_se,
geom = "errorbar", width = 0.2, size = 0.2
)Warning: Using `size` aesthetic for lines was deprecated in ggplot2 3.4.0.
ℹ Please use `linewidth` instead.girafe(ggobj = gg_point,
width_svg = 8,
height_svg = 8*0.618)p <- ggplot(data=exam_data,
aes(x = MATHS)) +
geom_dotplot_interactive(
aes(data_id = CLASS),
stackgroups = TRUE,
binwidth = 1,
method = "histodot") +
scale_y_continuous(NULL,
breaks = NULL)
girafe(
ggobj = p,
width_svg = 6,
height_svg = 6*0.618
) p <- ggplot(data=exam_data,
aes(x = MATHS)) +
geom_dotplot_interactive(
aes(tooltip = CLASS,
data_id = CLASS),
stackgroups = TRUE,
binwidth = 1,
method = "histodot") +
scale_y_continuous(NULL,
breaks = NULL)
girafe(
ggobj = p,
width_svg = 6,
height_svg = 6*0.618,
options = list(
opts_hover(css = "fill: #202020;"),
opts_hover_inv(css = "opacity:0.2;")
)
) exam_data$onclick <- sprintf("window.open(\"%s%s\")",
"https://www.moe.gov.sg/schoolfinder?journey=Primary%20school",
as.character(exam_data$ID))
p <- ggplot(data=exam_data,
aes(x = MATHS)) +
geom_dotplot_interactive(
aes(onclick = onclick),
stackgroups = TRUE,
binwidth = 1,
method = "histodot") +
scale_y_continuous(NULL,
breaks = NULL)
girafe(
ggobj = p,
width_svg = 6,
height_svg = 6*0.618) p1 <- ggplot(data=exam_data,
aes(x = MATHS)) +
geom_dotplot_interactive(
aes(data_id = ID),
stackgroups = TRUE,
binwidth = 1,
method = "histodot") +
coord_cartesian(xlim=c(0,100)) +
scale_y_continuous(NULL,
breaks = NULL)
p2 <- ggplot(data=exam_data,
aes(x = ENGLISH)) +
geom_dotplot_interactive(
aes(data_id = ID),
stackgroups = TRUE,
binwidth = 1,
method = "histodot") +
coord_cartesian(xlim=c(0,100)) +
scale_y_continuous(NULL,
breaks = NULL)
girafe(code = print(p1 + p2),
width_svg = 6,
height_svg = 3,
options = list(
opts_hover(css = "fill: #202020;"),
opts_hover_inv(css = "opacity:0.2;")
)
) With Plotly
plot_ly(data = exam_data, x = ~MATHS, y = ~ENGLISH)No trace type specified:
Based on info supplied, a 'scatter' trace seems appropriate.
Read more about this trace type -> https://plotly.com/r/reference/#scatterNo scatter mode specifed:
Setting the mode to markers
Read more about this attribute -> https://plotly.com/r/reference/#scatter-modep <- ggplot(data=exam_data,
aes(x = MATHS,
y = ENGLISH)) +
geom_point(size=1) +
coord_cartesian(xlim=c(0,100),
ylim=c(0,100))
ggplotly(p)d <- highlight_key(exam_data)
p1 <- ggplot(data=d,
aes(x = MATHS,
y = ENGLISH)) +
geom_point(size=1) +
coord_cartesian(xlim=c(0,100),
ylim=c(0,100))
p2 <- ggplot(data=d,
aes(x = MATHS,
y = SCIENCE)) +
geom_point(size=1) +
coord_cartesian(xlim=c(0,100),
ylim=c(0,100))
subplot(ggplotly(p1),
ggplotly(p2))d <- highlight_key(exam_data)
p <- ggplot(d,
aes(ENGLISH,
MATHS)) +
geom_point(size=1) +
coord_cartesian(xlim=c(0,100),
ylim=c(0,100))
gg <- highlight(ggplotly(p),
"plotly_selected")
crosstalk::bscols(gg,
DT::datatable(d),
widths = 5) Setting the `off` event (i.e., 'plotly_deselect') to match the `on` event (i.e., 'plotly_selected'). You can change this default via the `highlight()` function.Reflections:
The key takeaway from this exercise is interactivity. Basically, it means different behaviors (show tips, open new page) when different actions (on click, on hover) occur.
Programming Animated Statistical Graphics
pacman::p_load(readxl, gifski, gapminder,
               plotly, gganimate, tidyverse)
col <- c("Country", "Continent")
globalPop <- read_xls("../data/GlobalPopulation.xls",
sheet="Data") %>%
mutate(across(col, as.factor)) %>%
mutate(Year = as.integer(Year))Warning: There was 1 warning in `mutate()`.
ℹ In argument: `across(col, as.factor)`.
Caused by warning:
! Using an external vector in selections was deprecated in tidyselect 1.1.0.
ℹ Please use `all_of()` or `any_of()` instead.
# Was:
data %>% select(col)
# Now:
data %>% select(all_of(col))
See <https://tidyselect.r-lib.org/reference/faq-external-vector.html>.ggplot(globalPop, aes(x = Old, y = Young,
size = Population,
colour = Country)) +
geom_point(alpha = 0.7,
show.legend = FALSE) +
scale_colour_manual(values = country_colors) +
scale_size(range = c(2, 12)) +
labs(title = 'Year: {frame_time}',
x = '% Aged',
y = '% Young') 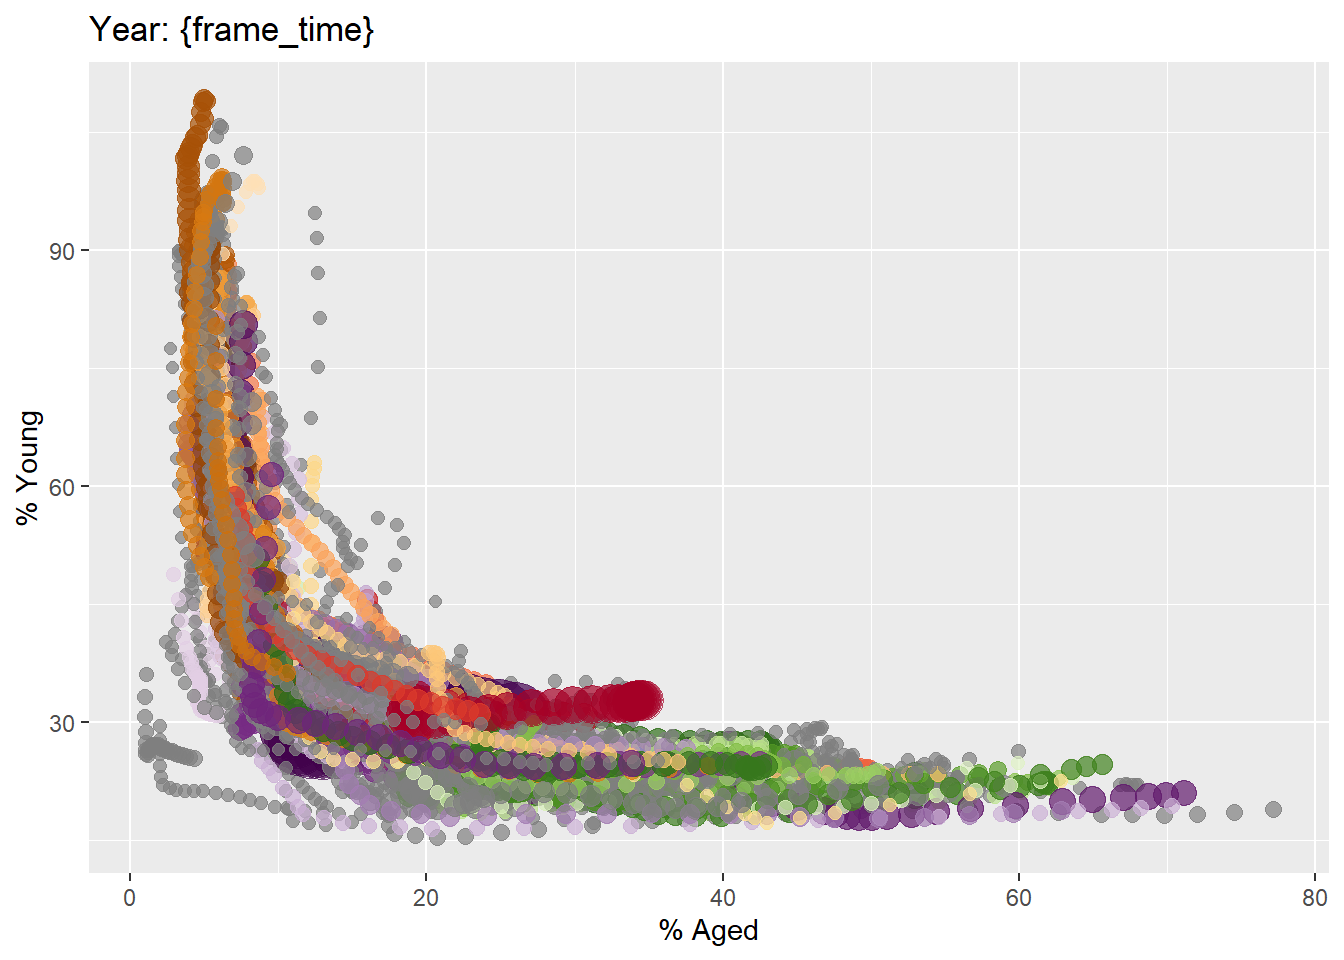
ggplot(globalPop, aes(x = Old, y = Young,
                      size = Population,
                      colour = Country)) +
  geom_point(alpha = 0.7,
             show.legend = FALSE) +
  scale_colour_manual(values = country_colors) +
  scale_size(range = c(2, 12)) +
  labs(title = 'Year: {frame_time}',
       x = '% Aged',
y = '% Young') +
transition_time(Year) +
ease_aes('linear') 
bp <- globalPop %>%
  plot_ly(x = ~Old,
          y = ~Young,
          size = ~Population,
          color = ~Continent,
          sizes = c(2, 100),
          frame = ~Year,
          text = ~Country,
          hoverinfo = "text",
          type = 'scatter',
          mode = 'markers'
          ) %>%
  layout(showlegend = FALSE)
bp
Warning: `line.width` does not currently support multiple values.
Warning: `line.width` does not currently support multiple values.
Warning: `line.width` does not currently support multiple values.
Warning: `line.width` does not currently support multiple values.
Warning: `line.width` does not currently support multiple values.
Warning: `line.width` does not currently support multiple values.
Warning: `line.width` does not currently support multiple values.
Warning: `line.width` does not currently support multiple values.
Warning: `line.width` does not currently support multiple values.
Warning: `line.width` does not currently support multiple values.
Warning: `line.width` does not currently support multiple values.
Warning: `line.width` does not currently support multiple values.
Warning: `line.width` does not currently support multiple values.
Warning: `line.width` does not currently support multiple values.
Warning: `line.width` does not currently support multiple values.
Warning: `line.width` does not currently support multiple values.
Warning: `line.width` does not currently support multiple values.
Warning: `line.width` does not currently support multiple values.
Warning: `line.width` does not currently support multiple values.
Warning: `line.width` does not currently support multiple values.
Warning: `line.width` does not currently support multiple values.
Warning: `line.width` does not currently support multiple values.
Warning: `line.width` does not currently support multiple values.
Warning: `line.width` does not currently support multiple values.
Warning: `line.width` does not currently support multiple values.
Warning: `line.width` does not currently support multiple values.
Warning: `line.width` does not currently support multiple values.
Warning: `line.width` does not currently support multiple values.
Warning: `line.width` does not currently support multiple values.
Warning: `line.width` does not currently support multiple values.
Warning: `line.width` does not currently support multiple values.
Warning: `line.width` does not currently support multiple values.
Warning: `line.width` does not currently support multiple values.
Warning: `line.width` does not currently support multiple values.
Warning: `line.width` does not currently support multiple values.
Warning: `line.width` does not currently support multiple values.
Warning: `line.width` does not currently support multiple values.
Warning: `line.width` does not currently support multiple values.
Warning: `line.width` does not currently support multiple values.
Warning: `line.width` does not currently support multiple values.
Warning: `line.width` does not currently support multiple values.
Warning: `line.width` does not currently support multiple values.
Warning: `line.width` does not currently support multiple values.
Warning: `line.width` does not currently support multiple values.
Warning: `line.width` does not currently support multiple values.
Warning: `line.width` does not currently support multiple values.
Warning: `line.width` does not currently support multiple values.
Warning: `line.width` does not currently support multiple values.
Warning: `line.width` does not currently support multiple values.
Warning: `line.width` does not currently support multiple values.
Warning: `line.width` does not currently support multiple values.
Warning: `line.width` does not currently support multiple values.
Warning: `line.width` does not currently support multiple values.
Warning: `line.width` does not currently support multiple values.
Warning: `line.width` does not currently support multiple values.
Warning: `line.width` does not currently support multiple values.
Warning: `line.width` does not currently support multiple values.
Warning: `line.width` does not currently support multiple values.
Warning: `line.width` does not currently support multiple values.
Warning: `line.width` does not currently support multiple values.
Warning: `line.width` does not currently support multiple values.
Warning: `line.width` does not currently support multiple values.
Warning: `line.width` does not currently support multiple values.
Warning: `line.width` does not currently support multiple values.
Warning: `line.width` does not currently support multiple values.
Warning: `line.width` does not currently support multiple values.
Warning: `line.width` does not currently support multiple values.
Warning: `line.width` does not currently support multiple values.
Warning: `line.width` does not currently support multiple values.
Warning: `line.width` does not currently support multiple values.
Warning: `line.width` does not currently support multiple values.
Warning: `line.width` does not currently support multiple values.
Warning: `line.width` does not currently support multiple values.
Warning: `line.width` does not currently support multiple values.
Warning: `line.width` does not currently support multiple values.
Warning: `line.width` does not currently support multiple values.
Warning: `line.width` does not currently support multiple values.
Warning: `line.width` does not currently support multiple values.
Warning: `line.width` does not currently support multiple values.
Warning: `line.width` does not currently support multiple values.
Warning: `line.width` does not currently support multiple values.
Warning: `line.width` does not currently support multiple values.
Warning: `line.width` does not currently support multiple values.
Warning: `line.width` does not currently support multiple values.
Warning: `line.width` does not currently support multiple values.
Warning: `line.width` does not currently support multiple values.
Warning: `line.width` does not currently support multiple values.
Warning: `line.width` does not currently support multiple values.
Warning: `line.width` does not currently support multiple values.
Warning: `line.width` does not currently support multiple values.
Warning: `line.width` does not currently support multiple values.
Warning: `line.width` does not currently support multiple values.
Warning: `line.width` does not currently support multiple values.
Warning: `line.width` does not currently support multiple values.
Warning: `line.width` does not currently support multiple values.
Warning: `line.width` does not currently support multiple values.
Warning: `line.width` does not currently support multiple values.
Warning: `line.width` does not currently support multiple values.
Warning: `line.width` does not currently support multiple values.
Warning: `line.width` does not currently support multiple values.
Warning: `line.width` does not currently support multiple values.
Warning: `line.width` does not currently support multiple values.
Warning: `line.width` does not currently support multiple values.
Warning: `line.width` does not currently support multiple values.
Warning: `line.width` does not currently support multiple values.
Warning: `line.width` does not currently support multiple values.
Warning: `line.width` does not currently support multiple values.
Warning: `line.width` does not currently support multiple values.
Warning: `line.width` does not currently support multiple values.
Warning: `line.width` does not currently support multiple values.
Warning: `line.width` does not currently support multiple values.
Warning: `line.width` does not currently support multiple values.
Warning: `line.width` does not currently support multiple values.
Warning: `line.width` does not currently support multiple values.
Warning: `line.width` does not currently support multiple values.
Warning: `line.width` does not currently support multiple values.
Warning: `line.width` does not currently support multiple values.
Warning: `line.width` does not currently support multiple values.
Warning: `line.width` does not currently support multiple values.
Warning: `line.width` does not currently support multiple values.
Warning: `line.width` does not currently support multiple values.
Warning: `line.width` does not currently support multiple values.
Warning: `line.width` does not currently support multiple values.
Warning: `line.width` does not currently support multiple values.
Warning: `line.width` does not currently support multiple values.
Warning: `line.width` does not currently support multiple values.
Warning: `line.width` does not currently support multiple values.
Warning: `line.width` does not currently support multiple values.
Warning: `line.width` does not currently support multiple values.
Warning: `line.width` does not currently support multiple values.
Warning: `line.width` does not currently support multiple values.
Warning: `line.width` does not currently support multiple values.
Warning: `line.width` does not currently support multiple values.
Warning: `line.width` does not currently support multiple values.
Warning: `line.width` does not currently support multiple values.
Warning: `line.width` does not currently support multiple values.
Warning: `line.width` does not currently support multiple values.
Warning: `line.width` does not currently support multiple values.
Warning: `line.width` does not currently support multiple values.
Warning: `line.width` does not currently support multiple values.
Warning: `line.width` does not currently support multiple values.
Warning: `line.width` does not currently support multiple values.
Warning: `line.width` does not currently support multiple values.
Warning: `line.width` does not currently support multiple values.
Warning: `line.width` does not currently support multiple values.
Warning: `line.width` does not currently support multiple values.
Warning: `line.width` does not currently support multiple values.
Warning: `line.width` does not currently support multiple values.
Warning: `line.width` does not currently support multiple values.
Warning: `line.width` does not currently support multiple values.
Warning: `line.width` does not currently support multiple values.
Warning: `line.width` does not currently support multiple values.
Warning: `line.width` does not currently support multiple values.
Warning: `line.width` does not currently support multiple values.
Warning: `line.width` does not currently support multiple values.
Warning: `line.width` does not currently support multiple values.
Warning: `line.width` does not currently support multiple values.
Warning: `line.width` does not currently support multiple values.
Warning: `line.width` does not currently support multiple values.
Warning: `line.width` does not currently support multiple values.
Warning: `line.width` does not currently support multiple values.
Warning: `line.width` does not currently support multiple values.
Warning: `line.width` does not currently support multiple values.
Warning: `line.width` does not currently support multiple values.
Warning: `line.width` does not currently support multiple values.
Warning: `line.width` does not currently support multiple values.
Warning: `line.width` does not currently support multiple values.
Warning: `line.width` does not currently support multiple values.Reflection:
The animation of visualization looks good, but may take some time to load it.