pacman::p_load(ggstatsplot, tidyverse)Hands-on 4
Visual Statistical Analysis
exam <- read_csv("../data/Exam_data.csv")Rows: 322 Columns: 7
── Column specification ────────────────────────────────────────────────────────
Delimiter: ","
chr (4): ID, CLASS, GENDER, RACE
dbl (3): ENGLISH, MATHS, SCIENCE
ℹ Use `spec()` to retrieve the full column specification for this data.
ℹ Specify the column types or set `show_col_types = FALSE` to quiet this message.set.seed(1234)
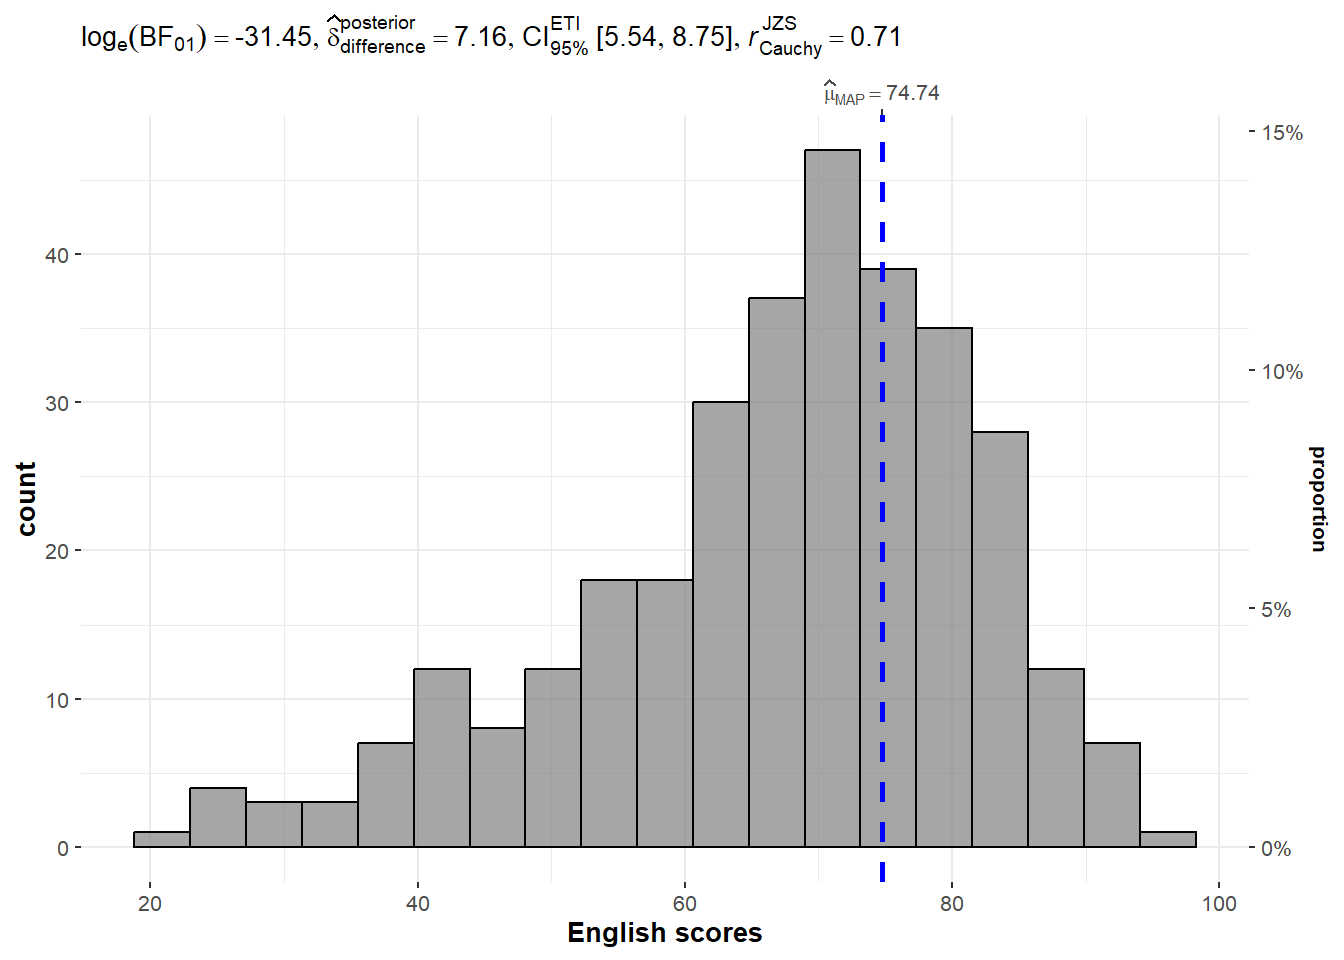
gghistostats(
data = exam,
x = ENGLISH,
type = "bayes",
test.value = 60,
xlab = "English scores"
)
ggbetweenstats(
  data = exam,
  x = GENDER,
  y = MATHS,
  type = "np",
  messages = FALSE
)
Warning in min(x): no non-missing arguments to min; returning InfWarning in max(x): no non-missing arguments to max; returning -Inf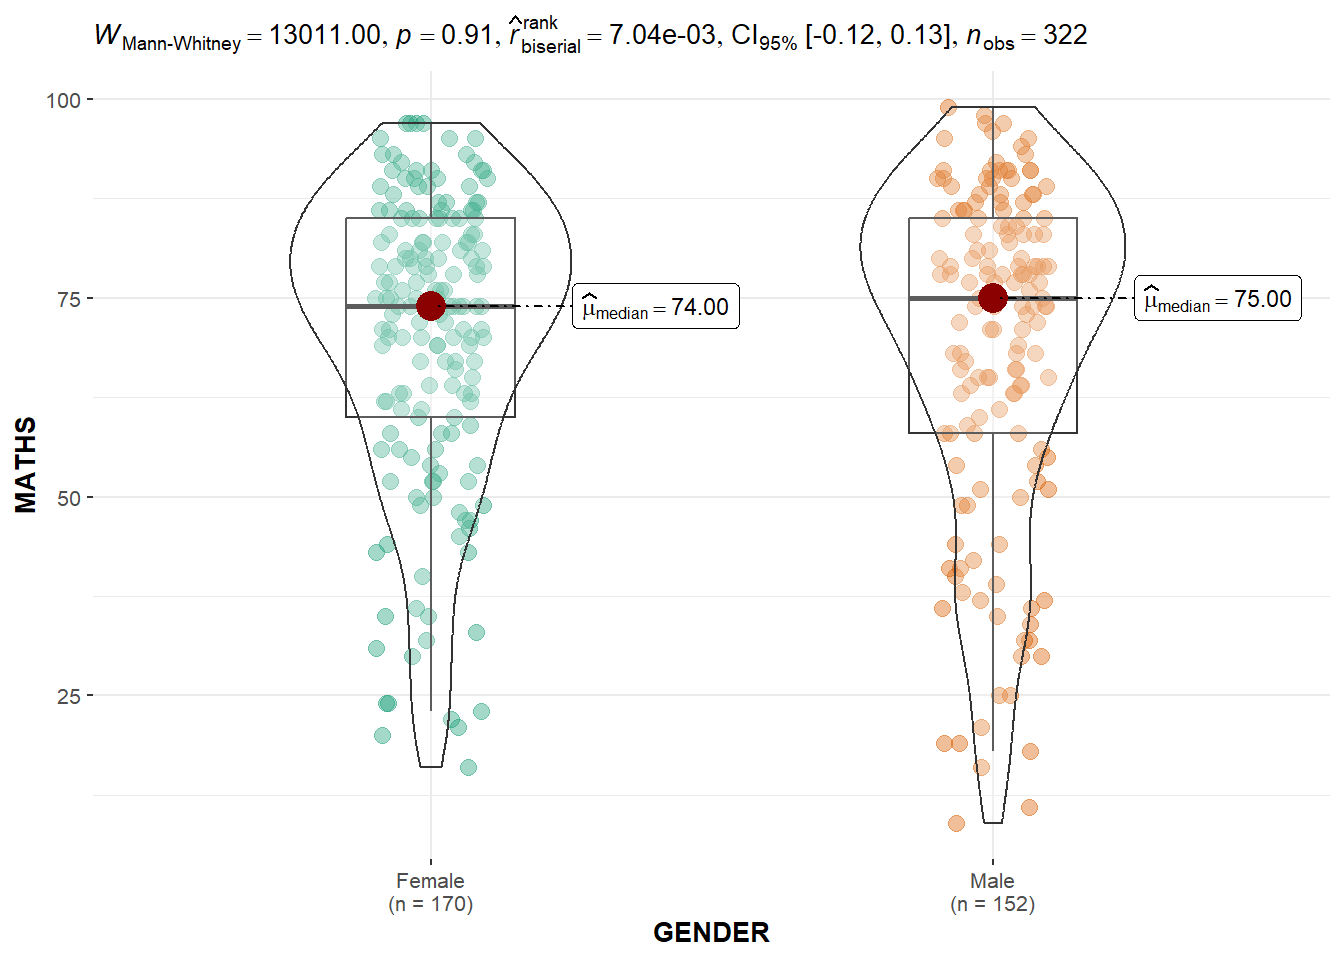
ggbetweenstats(
  data = exam,
  x = RACE,
  y = ENGLISH,
  type = "p",
  mean.ci = TRUE,
  pairwise.comparisons = TRUE,
  pairwise.display = "s",
  p.adjust.method = "fdr",
  messages = FALSE
)
Warning in min(x): no non-missing arguments to min; returning InfWarning in max(x): no non-missing arguments to max; returning -Inf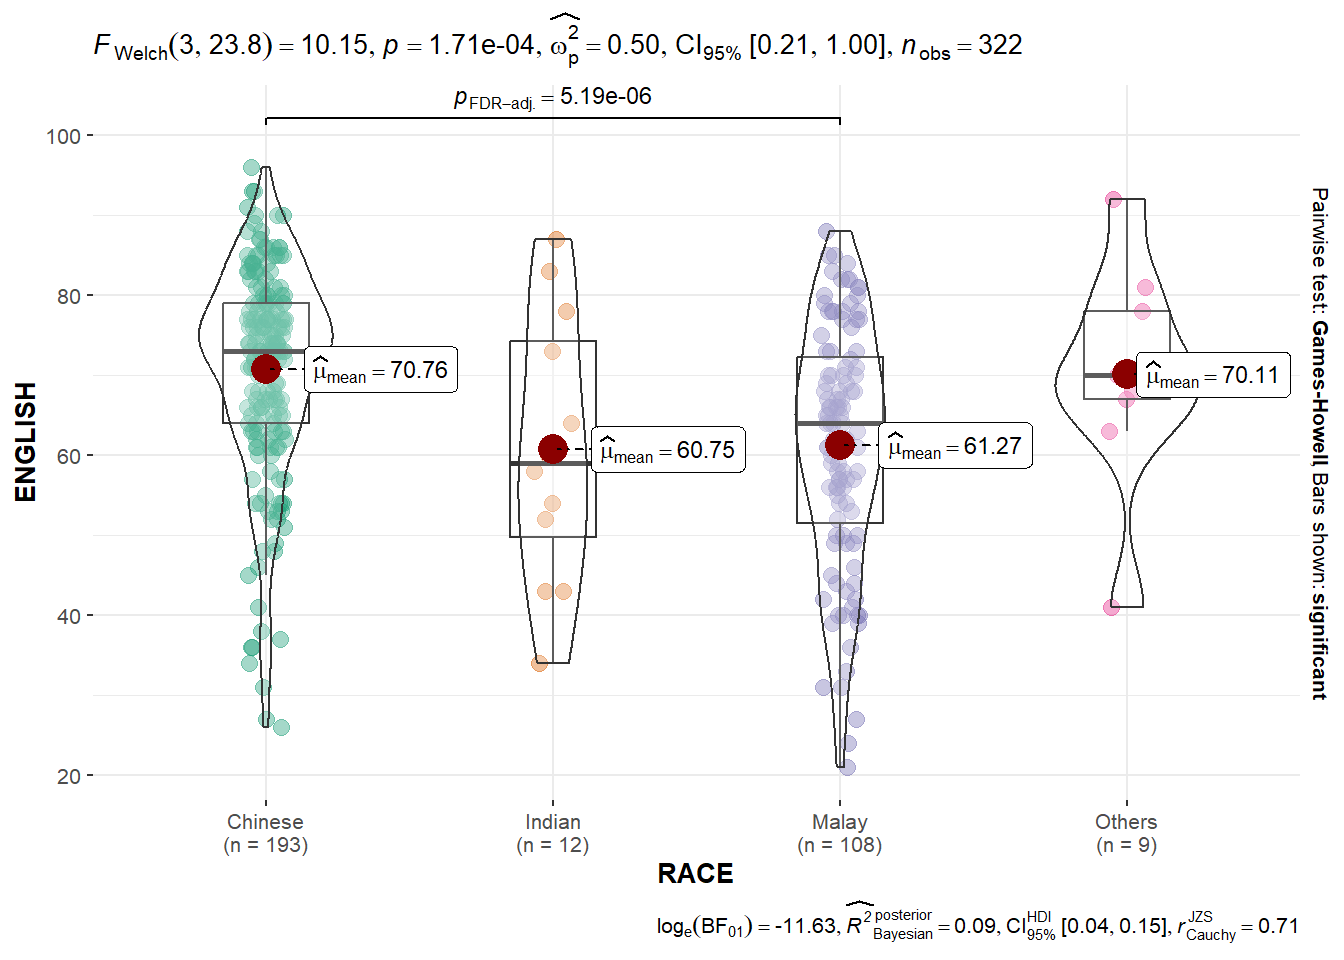
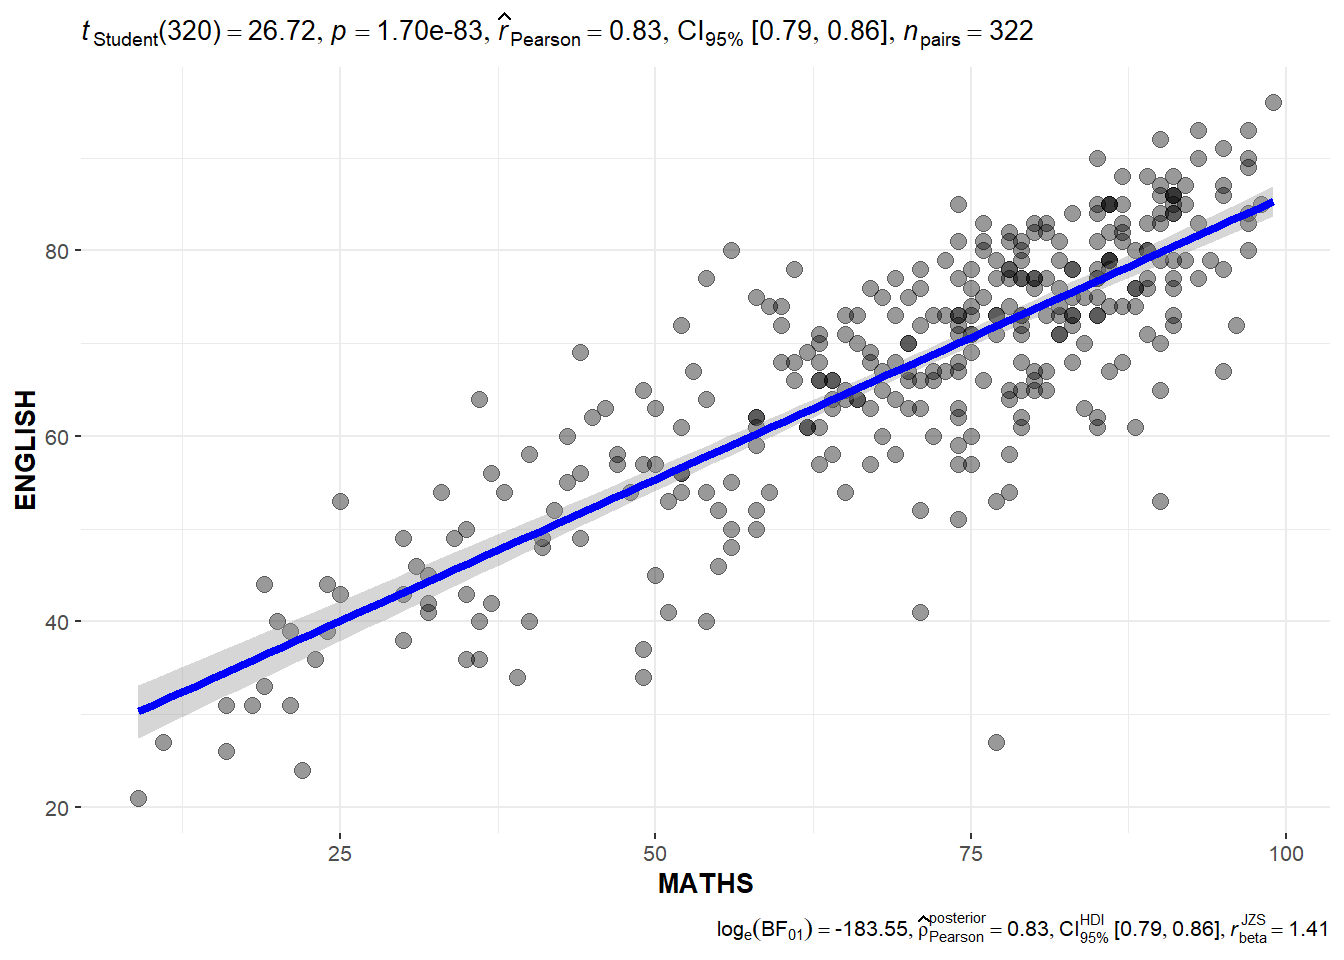
ggscatterstats(
  data = exam,
  x = MATHS,
  y = ENGLISH,
  marginal = FALSE,
  )
exam1 <- exam %>%
  mutate(MATHS_bins =
           cut(MATHS,
               breaks = c(0,60,75,85,100))
)

ggbarstats(exam1,
           x = MATHS_bins,
           y = GENDER)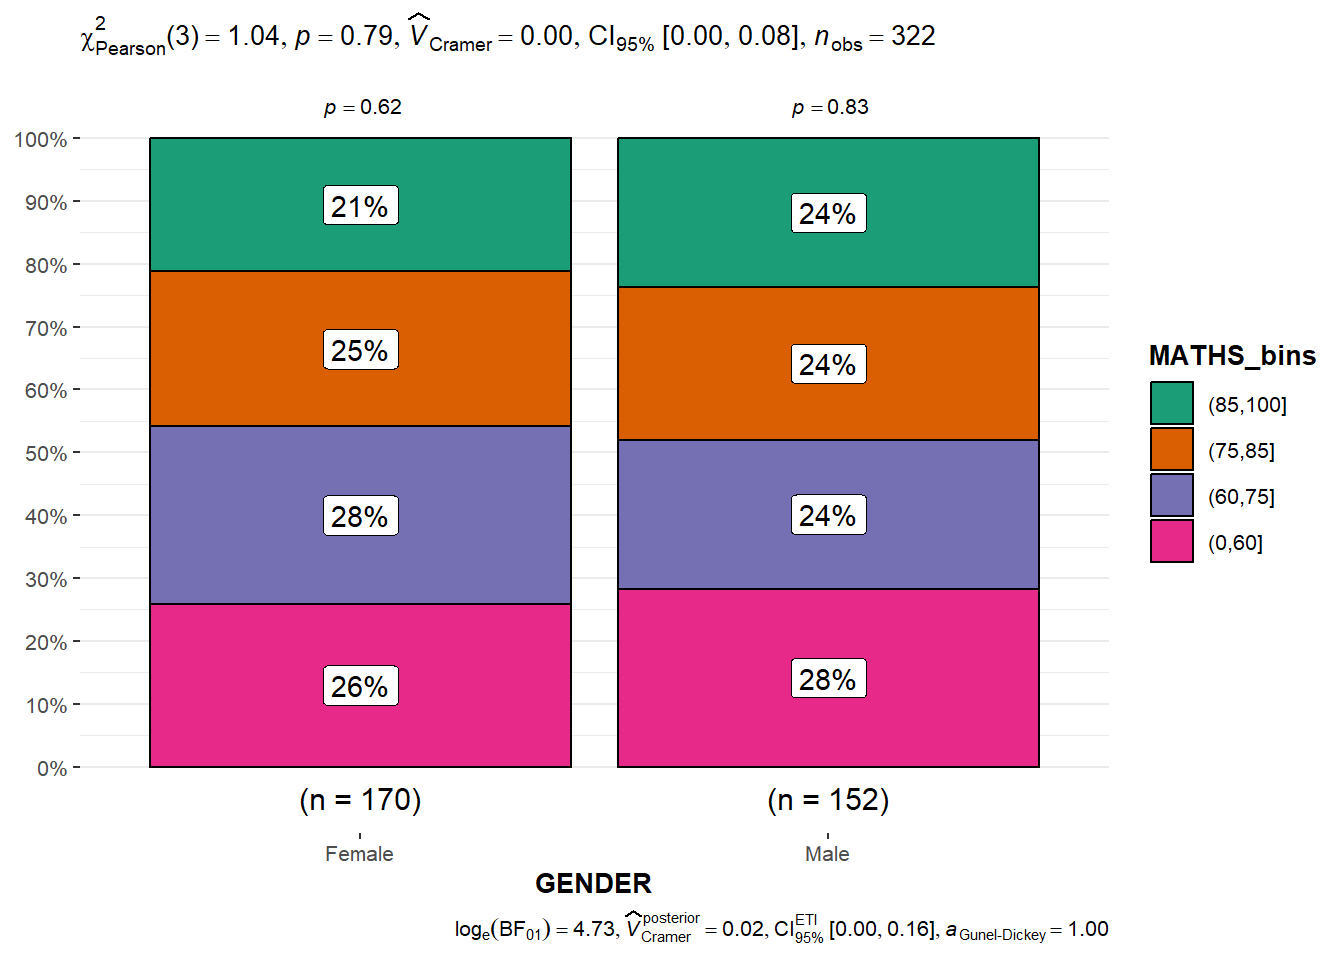
Reflection:
Learn how to retrieve more advanced statistical info from data.
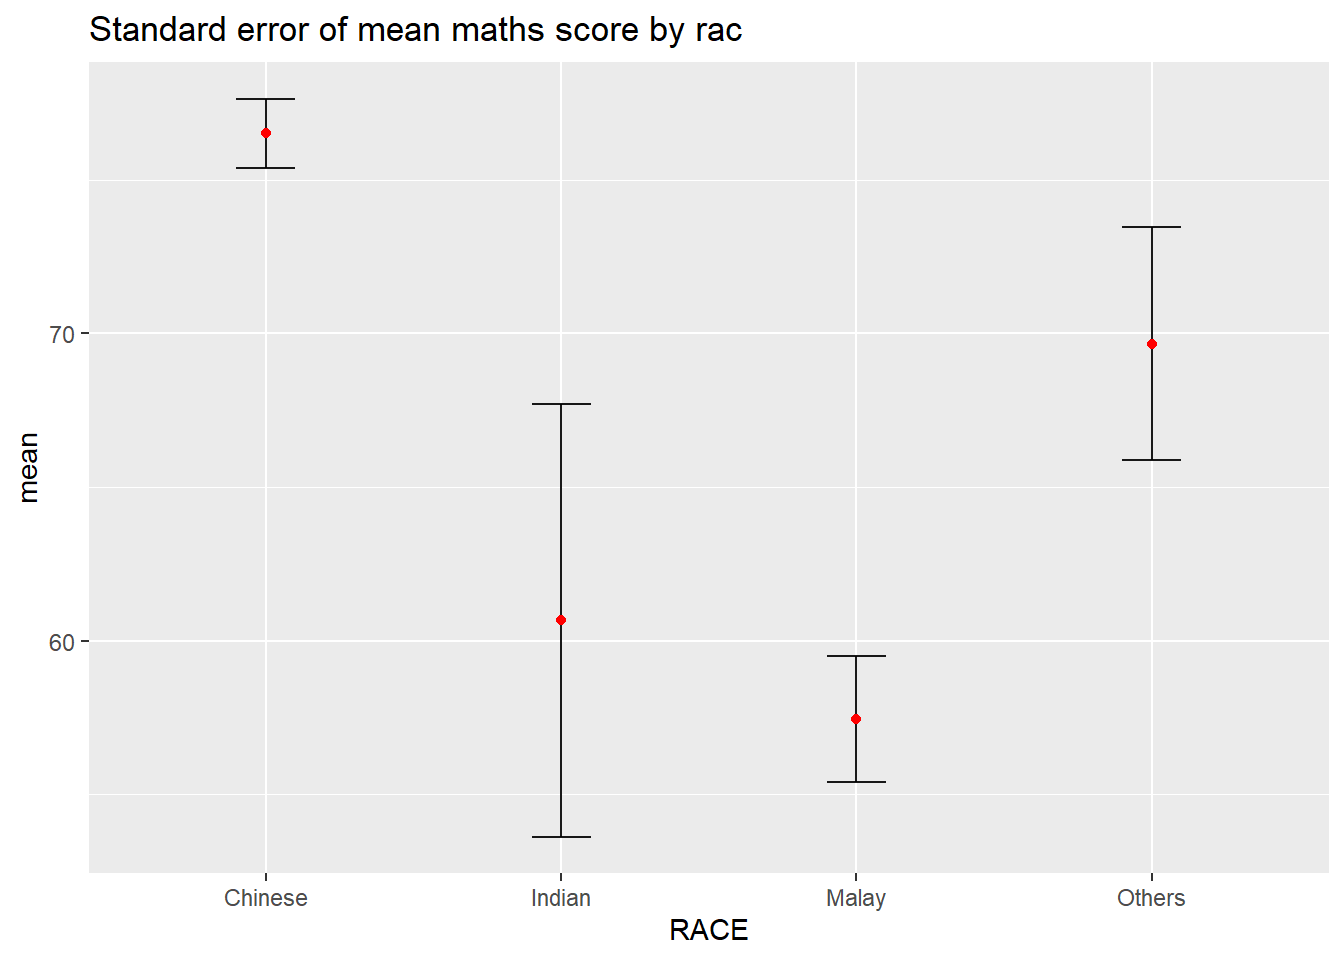
Visualising Uncertainty
exam <- read_csv("../data/Exam_data.csv")Rows: 322 Columns: 7
── Column specification ────────────────────────────────────────────────────────
Delimiter: ","
chr (4): ID, CLASS, GENDER, RACE
dbl (3): ENGLISH, MATHS, SCIENCE
ℹ Use `spec()` to retrieve the full column specification for this data.
ℹ Specify the column types or set `show_col_types = FALSE` to quiet this message.my_sum <- exam %>%
group_by(RACE) %>%
summarise(
n=n(),
mean=mean(MATHS),
sd=sd(MATHS)
) %>%
mutate(se=sd/sqrt(n-1))
ggplot(my_sum) +
geom_errorbar(
aes(x=RACE,
ymin=mean-se,
ymax=mean+se),
width=0.2,
colour="black",
alpha=0.9,
size=0.5) +
geom_point(aes
(x=RACE,
y=mean),
stat="identity",
color="red",
size = 1.5,
alpha=1) +
ggtitle("Standard error of mean maths score by rac")Warning: Using `size` aesthetic for lines was deprecated in ggplot2 3.4.0.
ℹ Please use `linewidth` instead.