pacman::p_load(tidyverse)
realis <- read_csv("../data/realis2019.csv")
Rows: 19515 Columns: 20
── Column specification ────────────────────────────────────────────────────────
Delimiter: ","
chr (12): Project Name, Address, Type of Area, Nett Price($), Sale Date, Pro...
dbl (8): No. of Units, Area (sqm), Transacted Price ($), Unit Price ($ psm)...
ℹ Use `spec()` to retrieve the full column specification for this data.
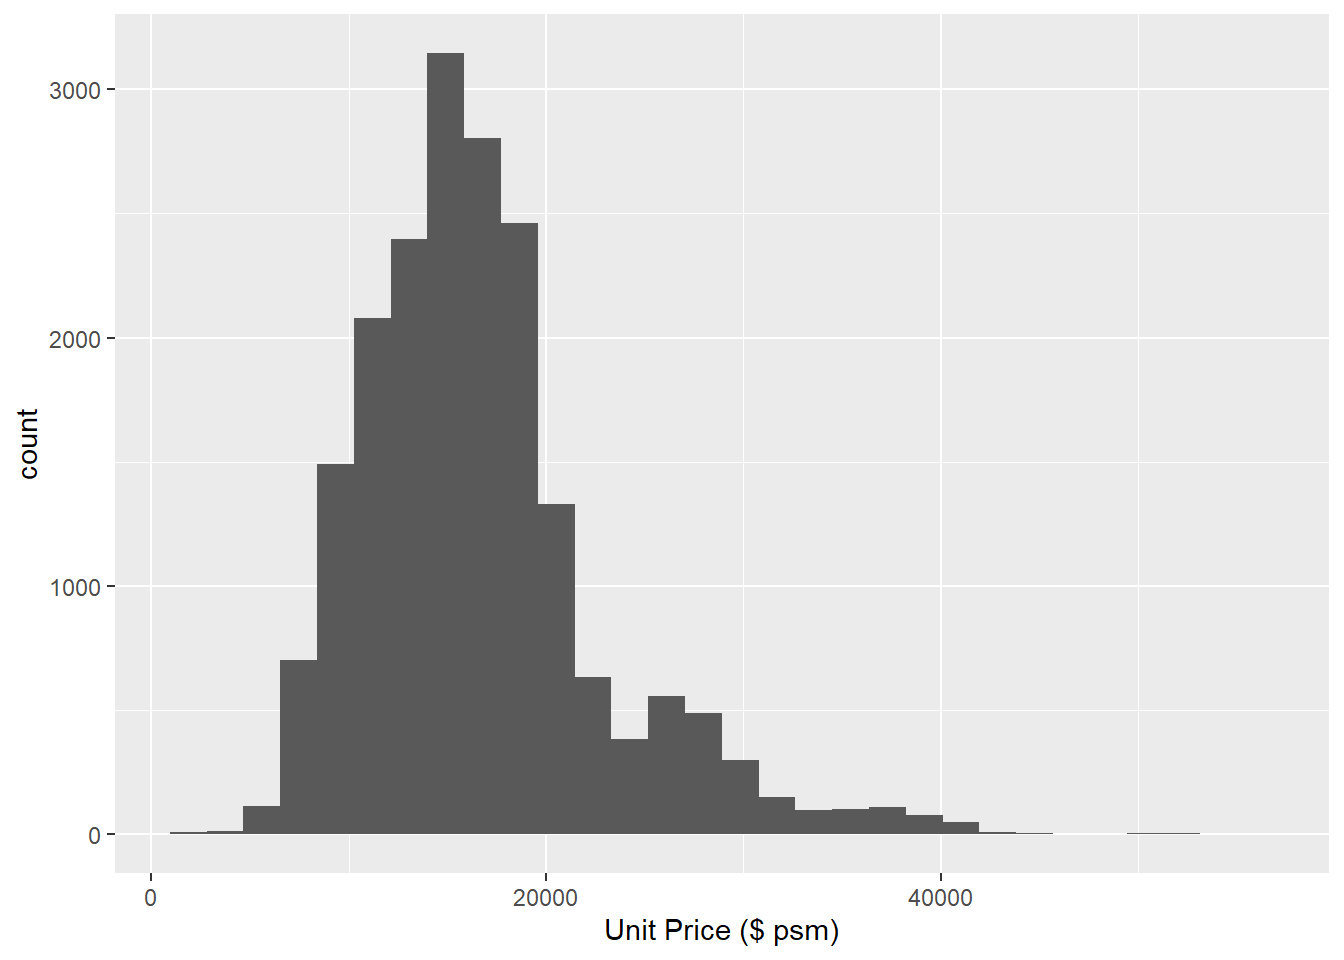
ℹ Specify the column types or set `show_col_types = FALSE` to quiet this message.ggplot(data = realis,
aes(x = `Unit Price ($ psm)`)) +
geom_histogram()`stat_bin()` using `bins = 30`. Pick better value with `binwidth`.