pacman::p_load(igraph, tidygraph, ggraph,
               visNetwork, lubridate, clock,
tidyverse, graphlayouts)Hands-on 6
Modelling, Visualising and Analysing Network Data with R
GAStech_nodes <- read_csv("../data/GAStech_email_node.csv")Rows: 54 Columns: 4
── Column specification ────────────────────────────────────────────────────────
Delimiter: ","
chr (3): label, Department, Title
dbl (1): id
ℹ Use `spec()` to retrieve the full column specification for this data.
ℹ Specify the column types or set `show_col_types = FALSE` to quiet this message.GAStech_edges <- read_csv("../data/GAStech_email_edge-v2.csv")Rows: 9063 Columns: 8
── Column specification ────────────────────────────────────────────────────────
Delimiter: ","
chr (5): SentDate, Subject, MainSubject, sourceLabel, targetLabel
dbl (2): source, target
time (1): SentTime
ℹ Use `spec()` to retrieve the full column specification for this data.
ℹ Specify the column types or set `show_col_types = FALSE` to quiet this message.GAStech_edges <- GAStech_edges %>%
mutate(SendDate = dmy(SentDate)) %>%
mutate(Weekday = wday(SentDate,
label = TRUE,
abbr = FALSE))GAStech_edges_aggregated <- GAStech_edges %>%
filter(MainSubject == "Work related") %>%
group_by(source, target, Weekday) %>%
summarise(Weight = n()) %>%
filter(source!=target) %>%
filter(Weight > 1) %>%
ungroup()`summarise()` has grouped output by 'source', 'target'. You can override using
the `.groups` argument.GAStech_graph <- tbl_graph(nodes = GAStech_nodes,
edges = GAStech_edges_aggregated,
directed = TRUE)ggraph(GAStech_graph) + geom_edge_link() + geom_node_point()Using "stress" as default layout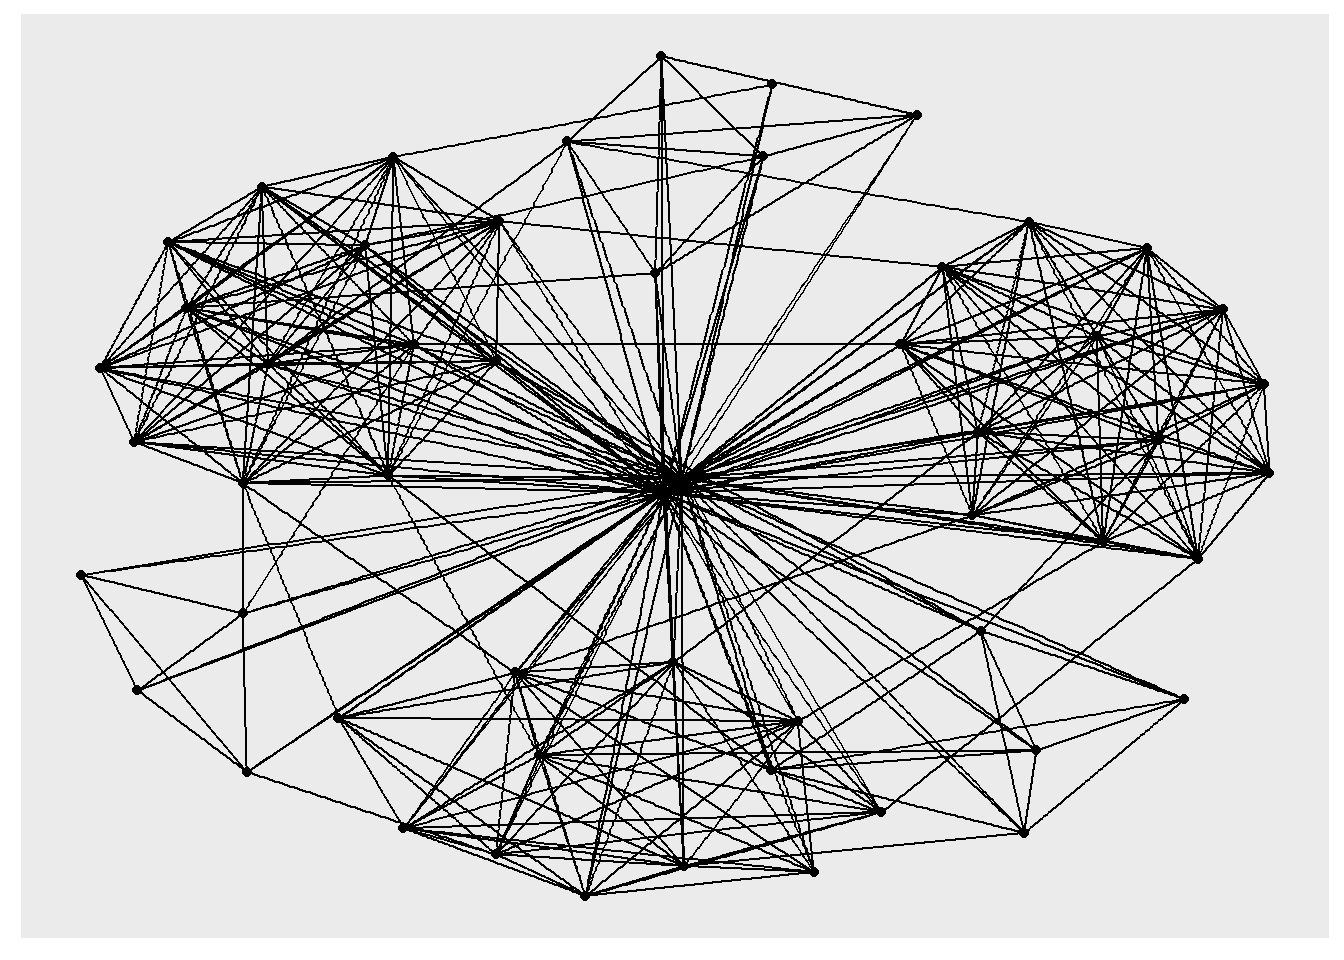
g <- ggraph(GAStech_graph,
            layout = "nicely") +
  geom_edge_link(aes()) +
  geom_node_point(aes(colour = Department,
                      size = 3))

g + theme_graph()
Warning in grid.Call(C_stringMetric, as.graphicsAnnot(x$label)): font family
not found in Windows font database
Warning in grid.Call(C_stringMetric, as.graphicsAnnot(x$label)): font family
not found in Windows font databaseWarning in grid.Call(C_textBounds, as.graphicsAnnot(x$label), x$x, x$y, : font
family not found in Windows font database
Warning in grid.Call(C_textBounds, as.graphicsAnnot(x$label), x$x, x$y, : font
family not found in Windows font database
Warning in grid.Call(C_textBounds, as.graphicsAnnot(x$label), x$x, x$y, : font
family not found in Windows font databaseWarning in grid.Call.graphics(C_text, as.graphicsAnnot(x$label), x$x, x$y, :
font family not found in Windows font database
Warning in grid.Call.graphics(C_text, as.graphicsAnnot(x$label), x$x, x$y, :
font family not found in Windows font database
Warning in grid.Call.graphics(C_text, as.graphicsAnnot(x$label), x$x, x$y, :
font family not found in Windows font database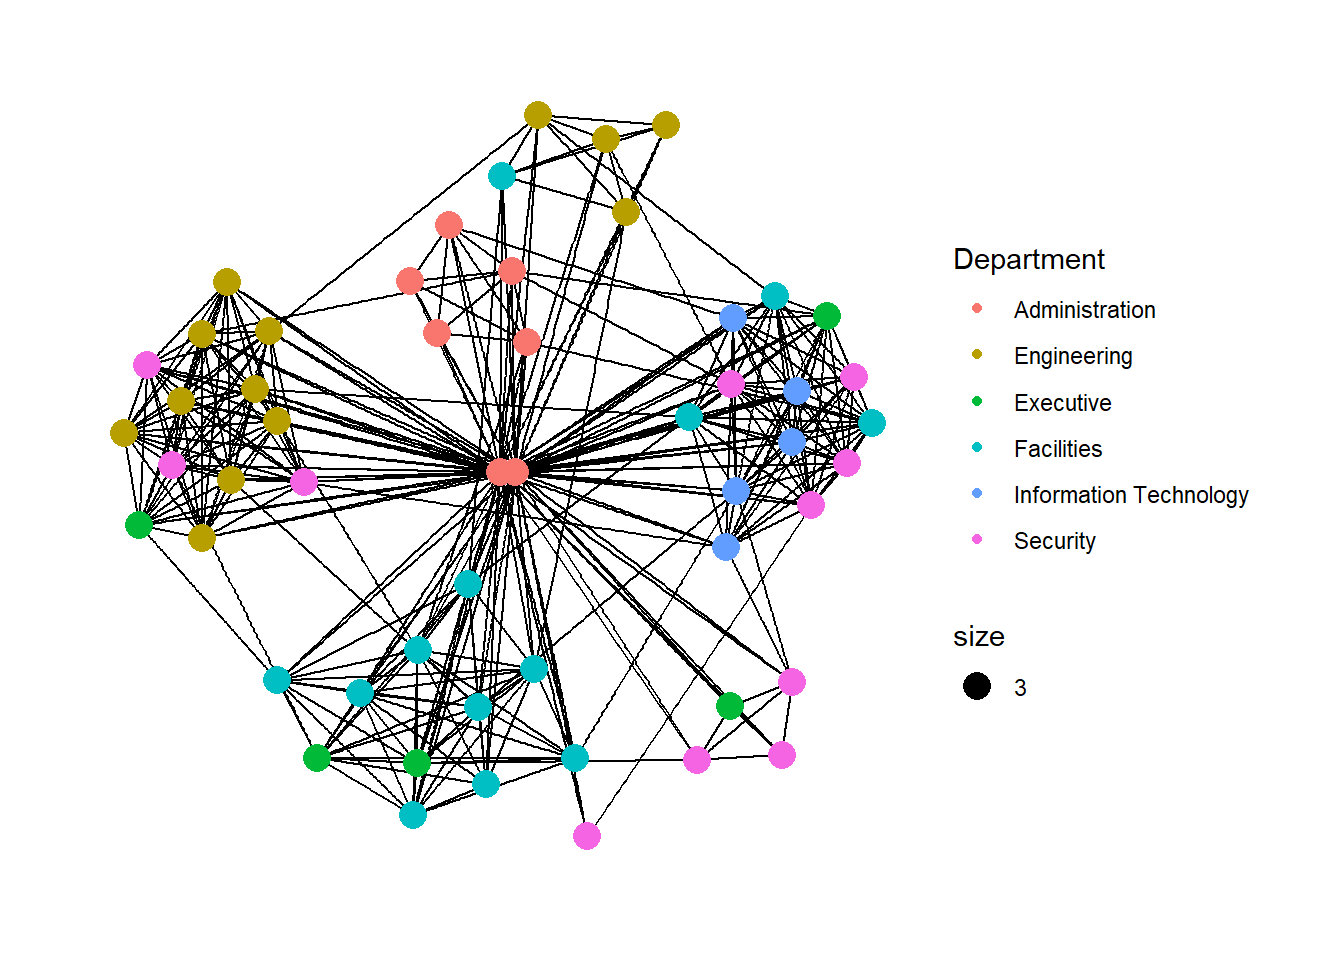
g <- ggraph(GAStech_graph,
layout = "nicely") +
geom_edge_link(aes(width=Weight),
alpha=0.2) +
scale_edge_width(range = c(0.1, 5)) +
geom_node_point(aes(colour = Department),
size = 3)
g + theme_graph()Warning in grid.Call(C_textBounds, as.graphicsAnnot(x$label), x$x, x$y, : font
family not found in Windows font database
Warning in grid.Call(C_textBounds, as.graphicsAnnot(x$label), x$x, x$y, : font
family not found in Windows font database
Warning in grid.Call(C_textBounds, as.graphicsAnnot(x$label), x$x, x$y, : font
family not found in Windows font database
Warning in grid.Call(C_textBounds, as.graphicsAnnot(x$label), x$x, x$y, : font
family not found in Windows font database
Warning in grid.Call.graphics(C_text, as.graphicsAnnot(x$label), x$x, x$y, :
font family not found in Windows font database
Warning in grid.Call.graphics(C_text, as.graphicsAnnot(x$label), x$x, x$y, :
font family not found in Windows font database
Warning in grid.Call.graphics(C_text, as.graphicsAnnot(x$label), x$x, x$y, :
font family not found in Windows font database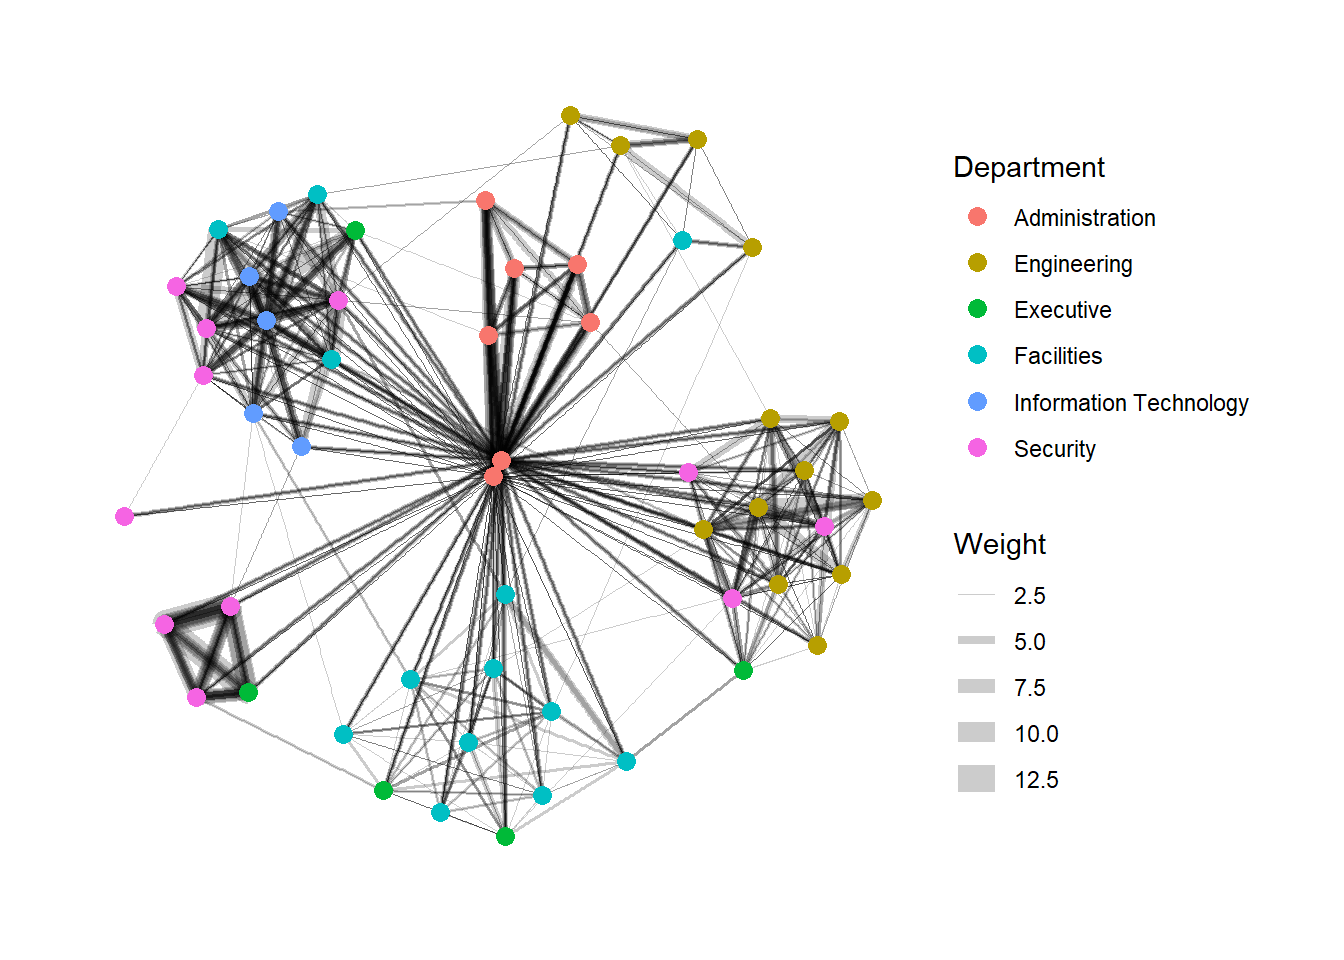
Reflection:
Visualize network with different configurations.