pacman::p_load(plotly, ggtern, tidyverse)Hands-on 9
Creating Ternary Plot
#Reading the data into R environment
pop_data <- read_csv("../data/respopagsex2000to2018_tidy.csv")
Rows: 108126 Columns: 5
── Column specification ────────────────────────────────────────────────────────
Delimiter: ","
chr (3): PA, SZ, AG
dbl (2): Year, Population
ℹ Use `spec()` to retrieve the full column specification for this data.
ℹ Specify the column types or set `show_col_types = FALSE` to quiet this message.#Deriving the young, economy active and old measures
agpop_mutated <- pop_data %>%
mutate(`Year` = as.character(Year))%>%
spread(AG, Population) %>%
mutate(YOUNG = rowSums(.[4:8]))%>%
mutate(ACTIVE = rowSums(.[9:16])) %>%
mutate(OLD = rowSums(.[17:21])) %>%
mutate(TOTAL = rowSums(.[22:24])) %>%
filter(Year == 2018)%>%
filter(TOTAL > 0)
#Building the static ternary plot
ggtern(data=agpop_mutated,aes(x=YOUNG,y=ACTIVE, z=OLD)) +
geom_point()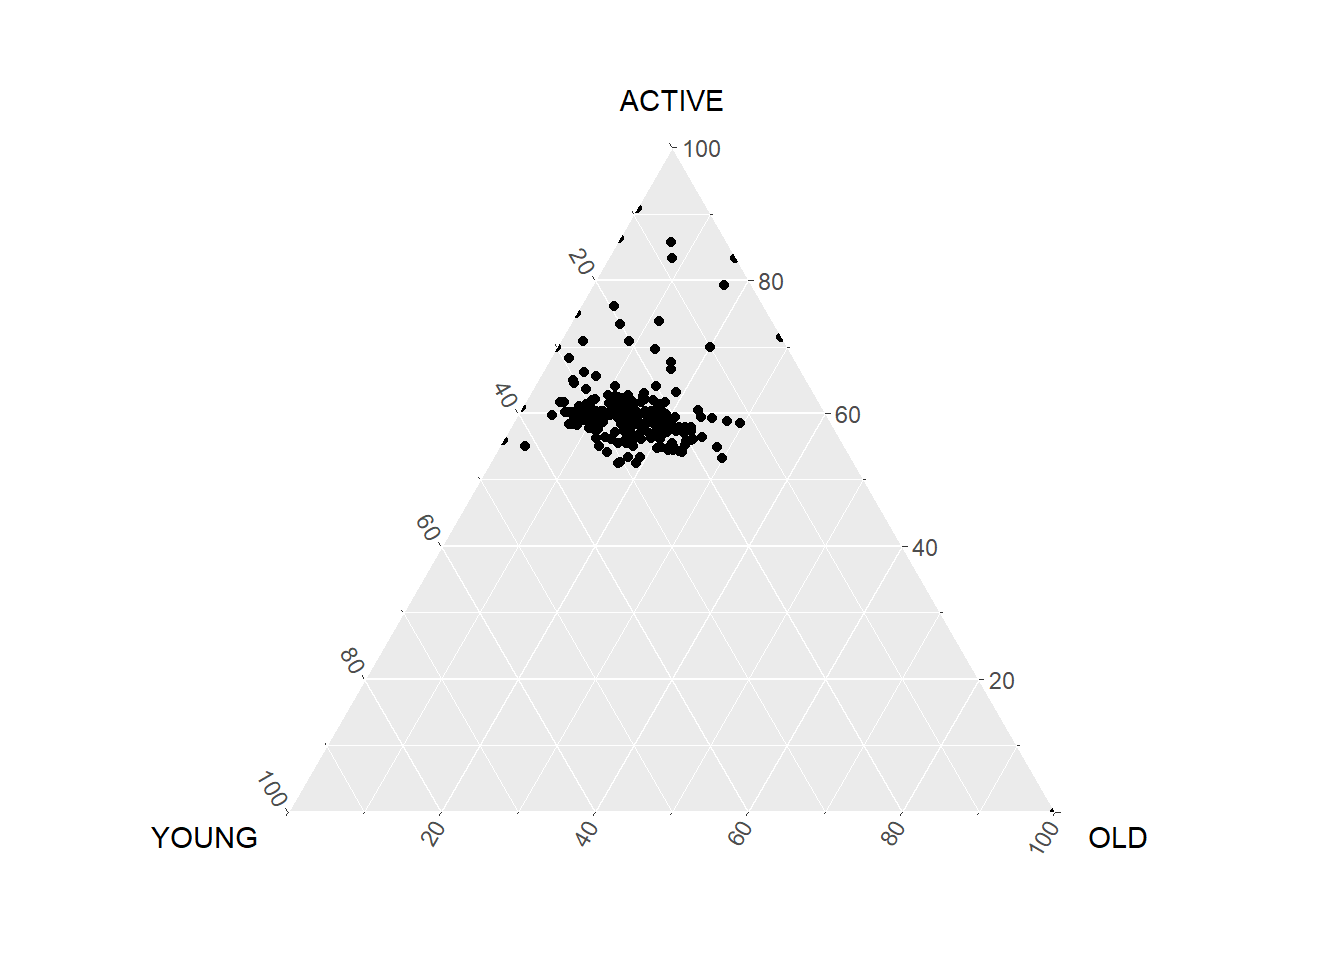
# reusable function for creating annotation object
label <- function(txt) {
  list(
    text = txt,
    x = 0.1, y = 1,
    ax = 0, ay = 0,
    xref = "paper", yref = "paper",
    align = "center",
    font = list(family = "serif", size = 15, color = "white"),
    bgcolor = "#b3b3b3", bordercolor = "black", borderwidth = 2
  )
}

# reusable function for axis formatting
axis <- function(txt) {
  list(
    title = txt, tickformat = ".0%", tickfont = list(size = 10)
  )
}

ternaryAxes <- list(
  aaxis = axis("Young"),
  baxis = axis("Active"),
  caxis = axis("Old")
)

# Initiating a plotly visualization
plot_ly(
  agpop_mutated,
  a = ~YOUNG,
  b = ~ACTIVE,
  c = ~OLD,
  color = I("black"),
  type = "scatterternary"
) %>%
  layout(
    annotations = label("Ternary Markers"),
    ternary = ternaryAxes
  )
No scatterternary mode specifed:
Setting the mode to markers
Read more about this attribute -> https://plotly.com/r/reference/#scatter-modeVisual Correlation Analysis
pacman::p_load(corrplot, ggstatsplot, tidyverse)
wine <- read_csv("../data/wine_quality.csv")
Rows: 6497 Columns: 13
── Column specification ────────────────────────────────────────────────────────
Delimiter: ","
chr (1): type
dbl (12): fixed acidity, volatile acidity, citric acid, residual sugar, chlo...
ℹ Use `spec()` to retrieve the full column specification for this data.
ℹ Specify the column types or set `show_col_types = FALSE` to quiet this message.pairs(wine[,1:11])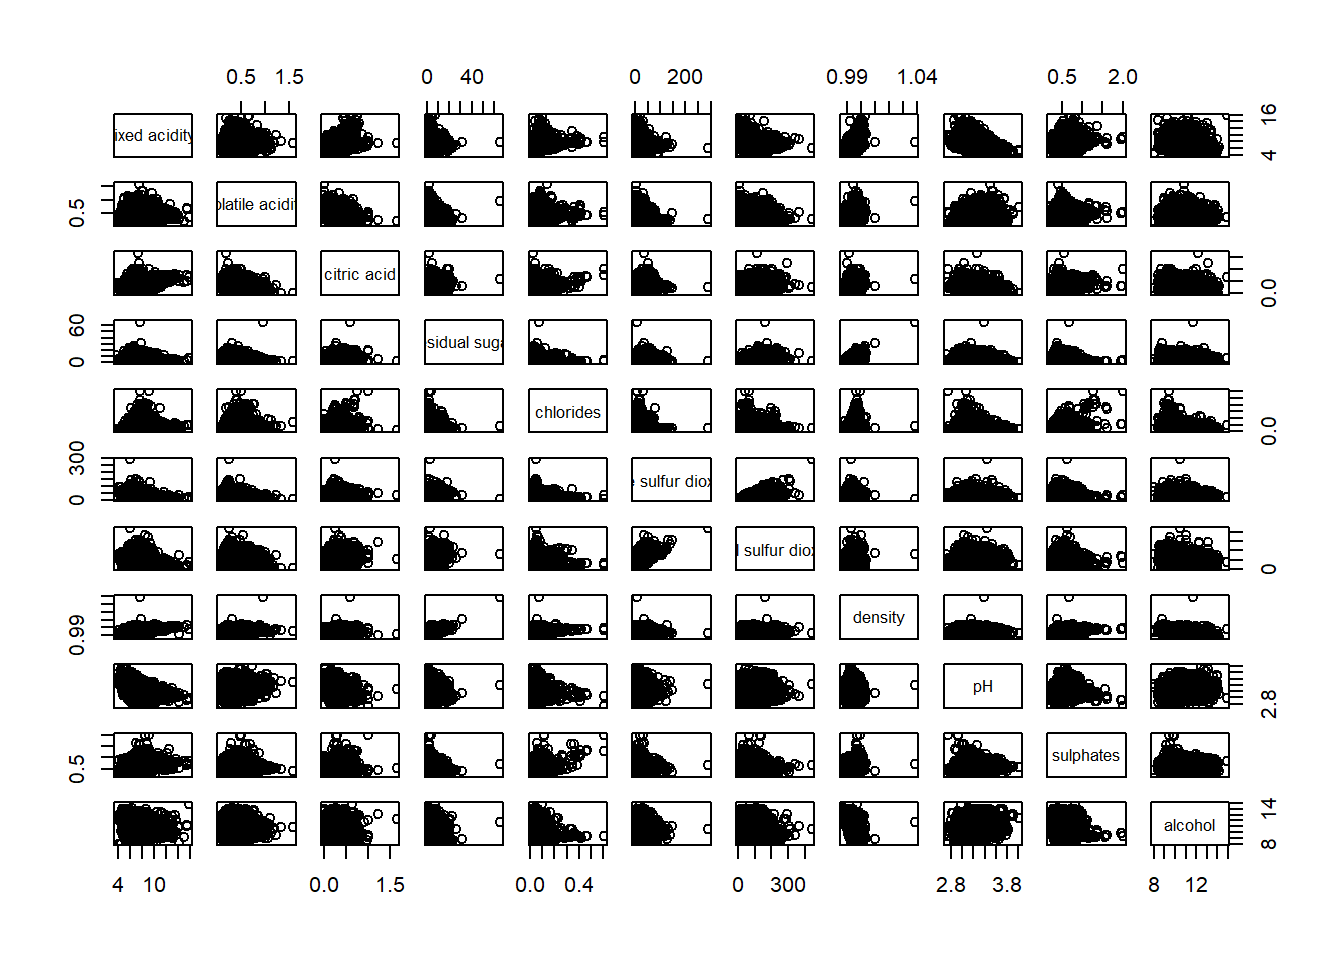
panel.cor <- function(x, y, digits=2, prefix="", cex.cor, ...) {
usr <- par("usr")
on.exit(par(usr))
par(usr = c(0, 1, 0, 1))
r <- abs(cor(x, y, use="complete.obs"))
txt <- format(c(r, 0.123456789), digits=digits)[1]
txt <- paste(prefix, txt, sep="")
if(missing(cex.cor)) cex.cor <- 0.8/strwidth(txt)
text(0.5, 0.5, txt, cex = cex.cor * (1 + r) / 2)
}

pairs(wine[,2:12],
      upper.panel = panel.cor)
Warning in par(usr): argument 1 does not name a graphical parameter
Warning in par(usr): argument 1 does not name a graphical parameter
Warning in par(usr): argument 1 does not name a graphical parameter
Warning in par(usr): argument 1 does not name a graphical parameter
Warning in par(usr): argument 1 does not name a graphical parameter
Warning in par(usr): argument 1 does not name a graphical parameter
Warning in par(usr): argument 1 does not name a graphical parameter
Warning in par(usr): argument 1 does not name a graphical parameter
Warning in par(usr): argument 1 does not name a graphical parameter
Warning in par(usr): argument 1 does not name a graphical parameter
Warning in par(usr): argument 1 does not name a graphical parameter
Warning in par(usr): argument 1 does not name a graphical parameter
Warning in par(usr): argument 1 does not name a graphical parameter
Warning in par(usr): argument 1 does not name a graphical parameter
Warning in par(usr): argument 1 does not name a graphical parameter
Warning in par(usr): argument 1 does not name a graphical parameter
Warning in par(usr): argument 1 does not name a graphical parameter
Warning in par(usr): argument 1 does not name a graphical parameter
Warning in par(usr): argument 1 does not name a graphical parameter
Warning in par(usr): argument 1 does not name a graphical parameter
Warning in par(usr): argument 1 does not name a graphical parameter
Warning in par(usr): argument 1 does not name a graphical parameter
Warning in par(usr): argument 1 does not name a graphical parameter
Warning in par(usr): argument 1 does not name a graphical parameter
Warning in par(usr): argument 1 does not name a graphical parameter
Warning in par(usr): argument 1 does not name a graphical parameter
Warning in par(usr): argument 1 does not name a graphical parameter
Warning in par(usr): argument 1 does not name a graphical parameter
Warning in par(usr): argument 1 does not name a graphical parameter
Warning in par(usr): argument 1 does not name a graphical parameter
Warning in par(usr): argument 1 does not name a graphical parameter
Warning in par(usr): argument 1 does not name a graphical parameter
Warning in par(usr): argument 1 does not name a graphical parameter
Warning in par(usr): argument 1 does not name a graphical parameter
Warning in par(usr): argument 1 does not name a graphical parameter
Warning in par(usr): argument 1 does not name a graphical parameter
Warning in par(usr): argument 1 does not name a graphical parameter
Warning in par(usr): argument 1 does not name a graphical parameter
Warning in par(usr): argument 1 does not name a graphical parameter
Warning in par(usr): argument 1 does not name a graphical parameter
Warning in par(usr): argument 1 does not name a graphical parameter
Warning in par(usr): argument 1 does not name a graphical parameter
Warning in par(usr): argument 1 does not name a graphical parameter
Warning in par(usr): argument 1 does not name a graphical parameter
Warning in par(usr): argument 1 does not name a graphical parameter
Warning in par(usr): argument 1 does not name a graphical parameter
Warning in par(usr): argument 1 does not name a graphical parameter
Warning in par(usr): argument 1 does not name a graphical parameter
Warning in par(usr): argument 1 does not name a graphical parameter
Warning in par(usr): argument 1 does not name a graphical parameter
Warning in par(usr): argument 1 does not name a graphical parameter
Warning in par(usr): argument 1 does not name a graphical parameter
Warning in par(usr): argument 1 does not name a graphical parameter
Warning in par(usr): argument 1 does not name a graphical parameter
Warning in par(usr): argument 1 does not name a graphical parameter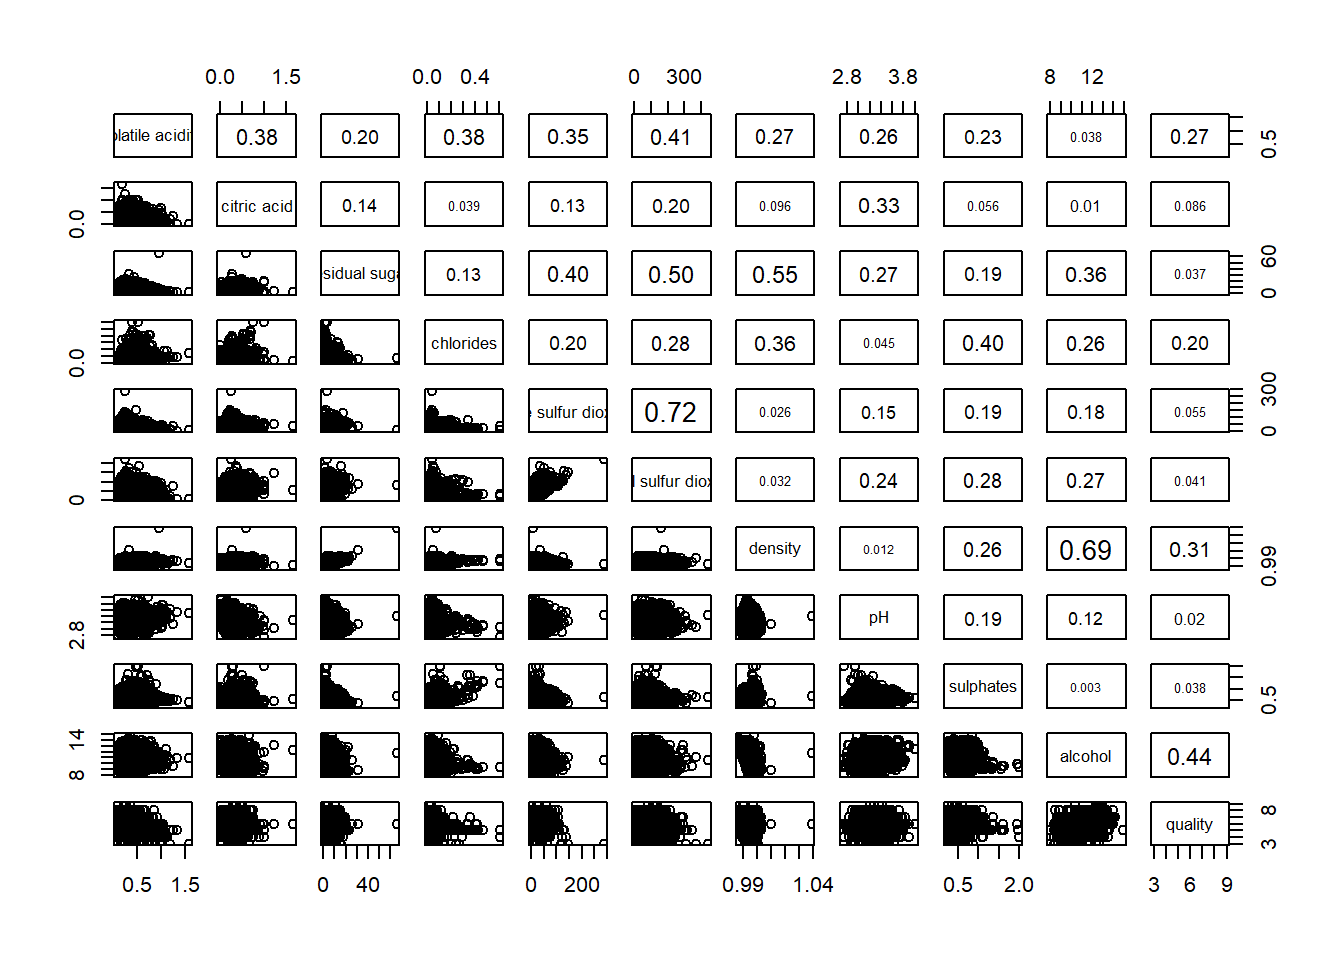
ggstatsplot::ggcorrmat(
  data = wine,
  cor.vars = 1:11)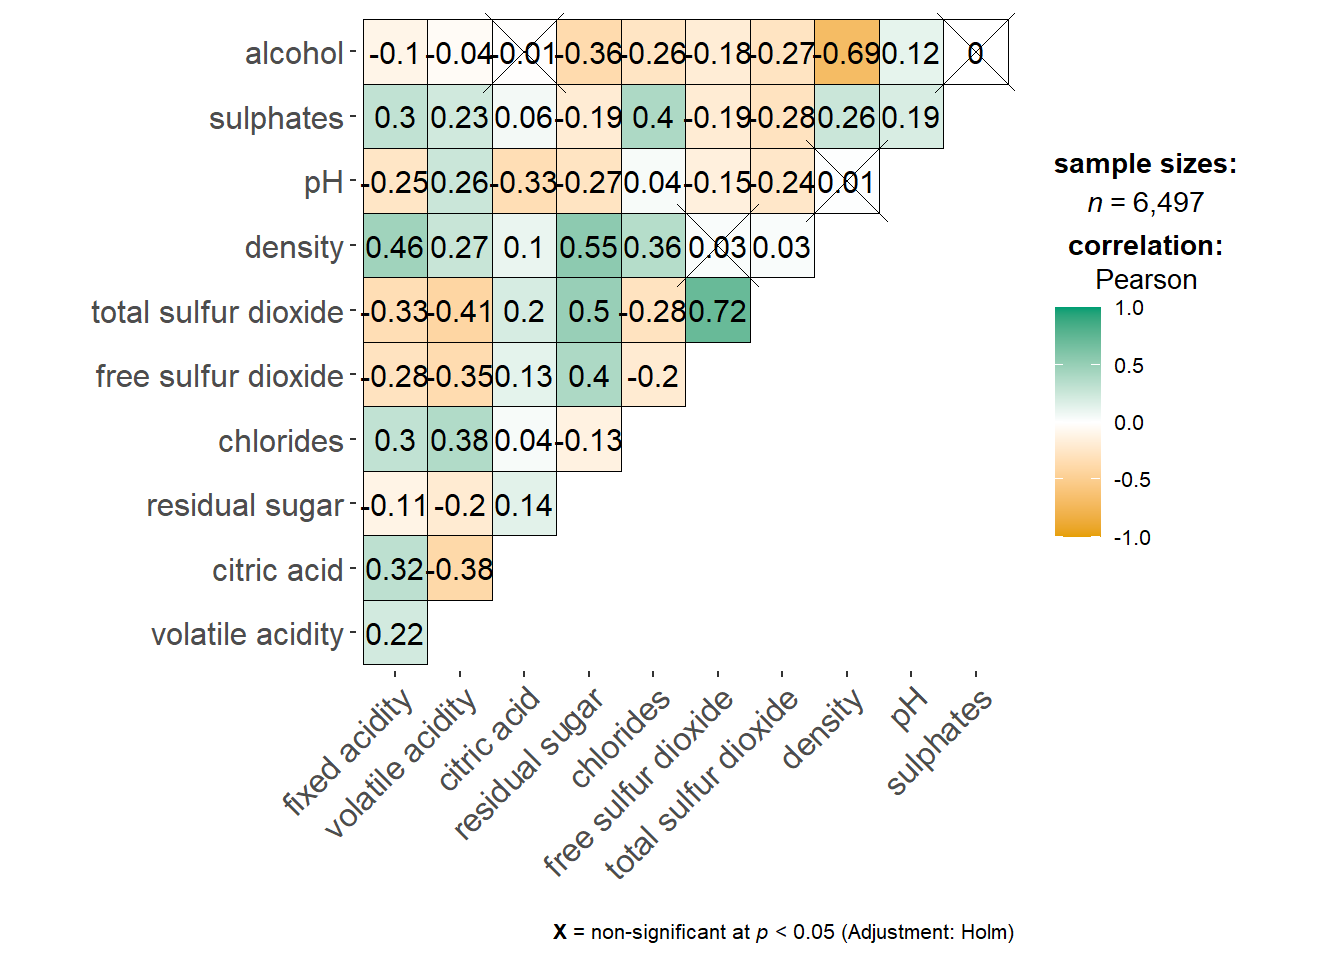
wine.cor <- cor(wine[, 1:11])
corrplot(wine.cor,
         method = "ellipse",
         tl.pos = "lt",
         tl.col = "black",
         order="hclust",
         hclust.method = "ward.D",
         addrect = 3)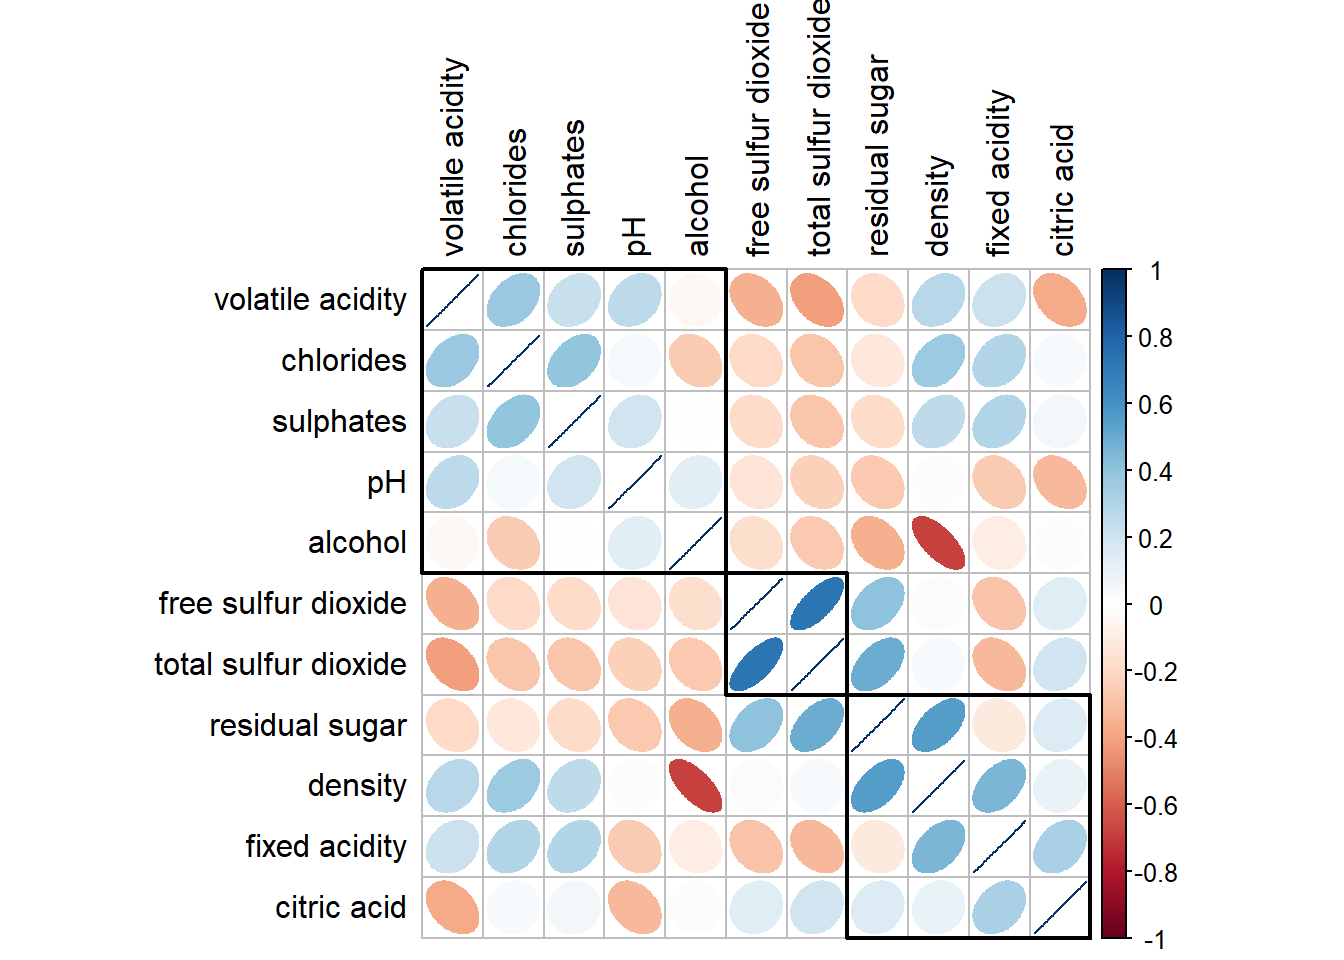
Heatmap for Visualising and Analysing Multivariate Data
pacman::p_load(seriation, dendextend, heatmaply, tidyverse)wh <- read_csv("../data/WHData-2018.csv")Rows: 156 Columns: 12
── Column specification ────────────────────────────────────────────────────────
Delimiter: ","
chr (2): Country, Region
dbl (10): Happiness score, Whisker-high, Whisker-low, Dystopia, GDP per capi...
ℹ Use `spec()` to retrieve the full column specification for this data.
ℹ Specify the column types or set `show_col_types = FALSE` to quiet this message.row.names(wh) <- wh$CountryWarning: Setting row names on a tibble is deprecated.wh1 <- dplyr::select(wh, c(3, 7:12))
wh_matrix <- data.matrix(wh)wh_heatmap <- heatmap(wh_matrix,
Rowv=NA, Colv=NA)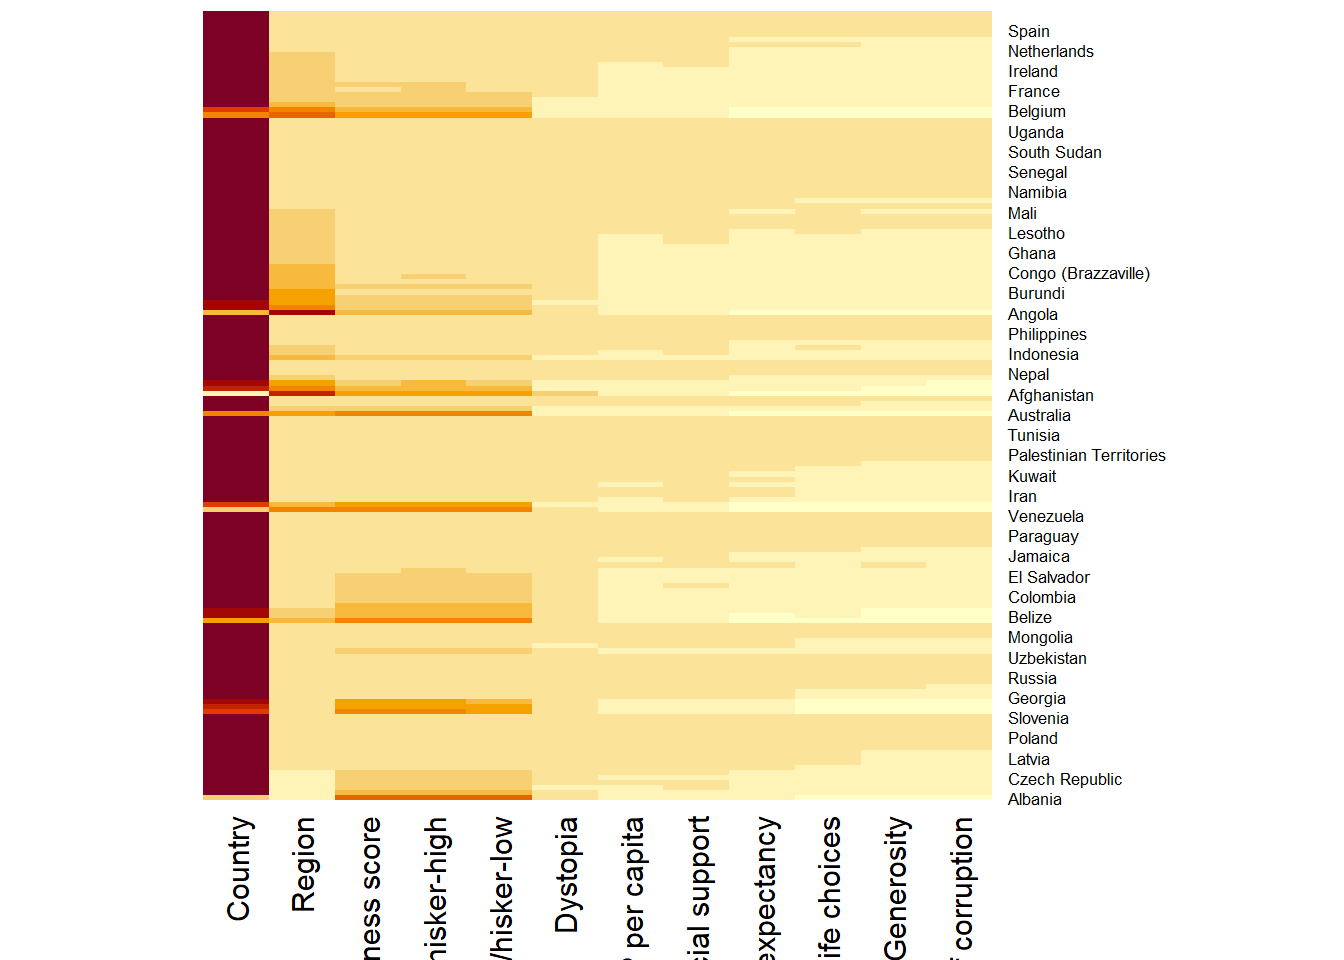
wh_d <- dist(normalize(wh_matrix[, -c(1, 2, 4, 5)]), method = "euclidean")
dend_expend(wh_d)[[3]]
dist_methods hclust_methods optim
1 unknown ward.D 0.6137851
2 unknown ward.D2 0.6289186
3 unknown single 0.4774362
4 unknown complete 0.6434009
5 unknown average 0.6701688
6 unknown mcquitty 0.5020102
7 unknown median 0.5901833
8 unknown centroid 0.6338734wh_clust <- hclust(wh_d, method = "average")
num_k <- find_k(wh_clust)
plot(num_k)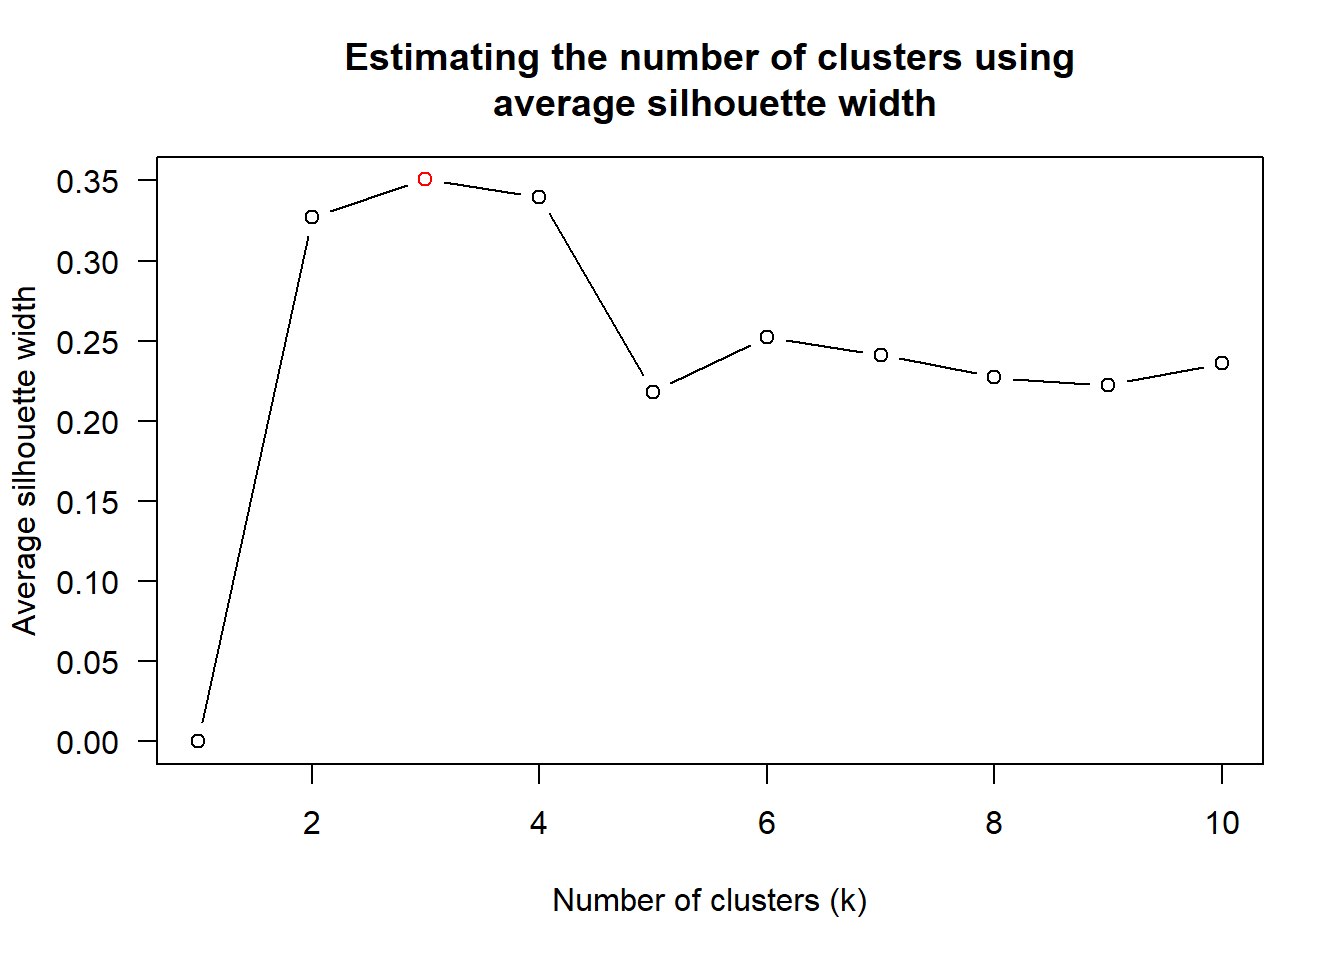
Visual Multivariate Analysis with Parallel Coordinates Plot
pacman::p_load(GGally, parallelPlot, tidyverse)wh <- read_csv("../data/WHData-2018.csv")Rows: 156 Columns: 12
── Column specification ────────────────────────────────────────────────────────
Delimiter: ","
chr (2): Country, Region
dbl (10): Happiness score, Whisker-high, Whisker-low, Dystopia, GDP per capi...
ℹ Use `spec()` to retrieve the full column specification for this data.
ℹ Specify the column types or set `show_col_types = FALSE` to quiet this message.ggparcoord(data = wh,
columns = c(7:12))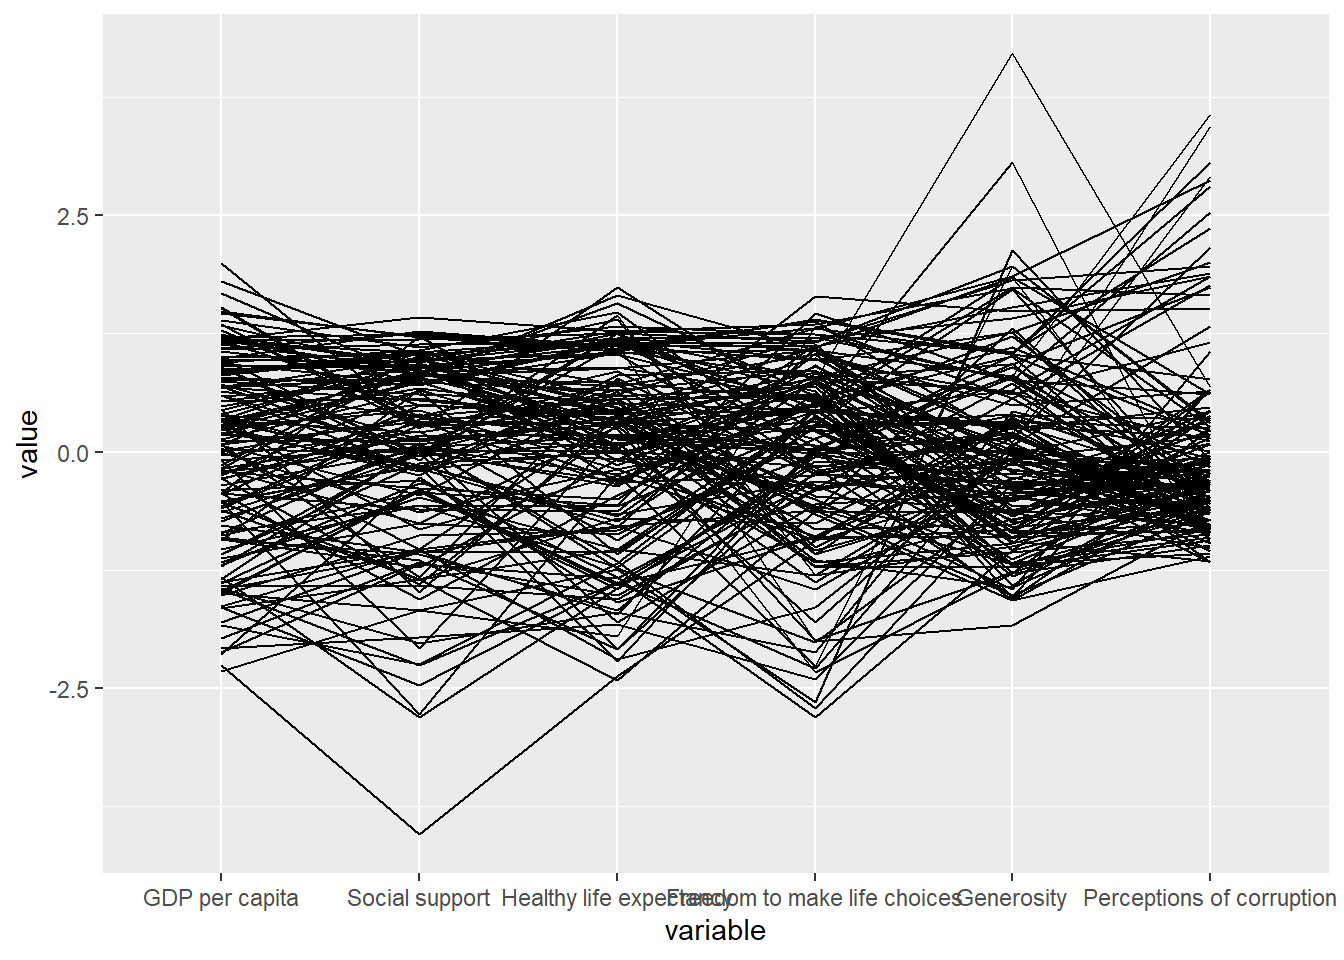
ggparcoord(data = wh,
           columns = c(7:12),
           groupColumn = 2,
           scale = "uniminmax",
           alphaLines = 0.2,
           boxplot = TRUE,
           title = "Parallel Coordinates Plot of World Happines Variables")
Warning: The following aesthetics were dropped during statistical transformation:
colour.
ℹ This can happen when ggplot fails to infer the correct grouping structure in
the data.
ℹ Did you forget to specify a `group` aesthetic or to convert a numerical
variable into a factor?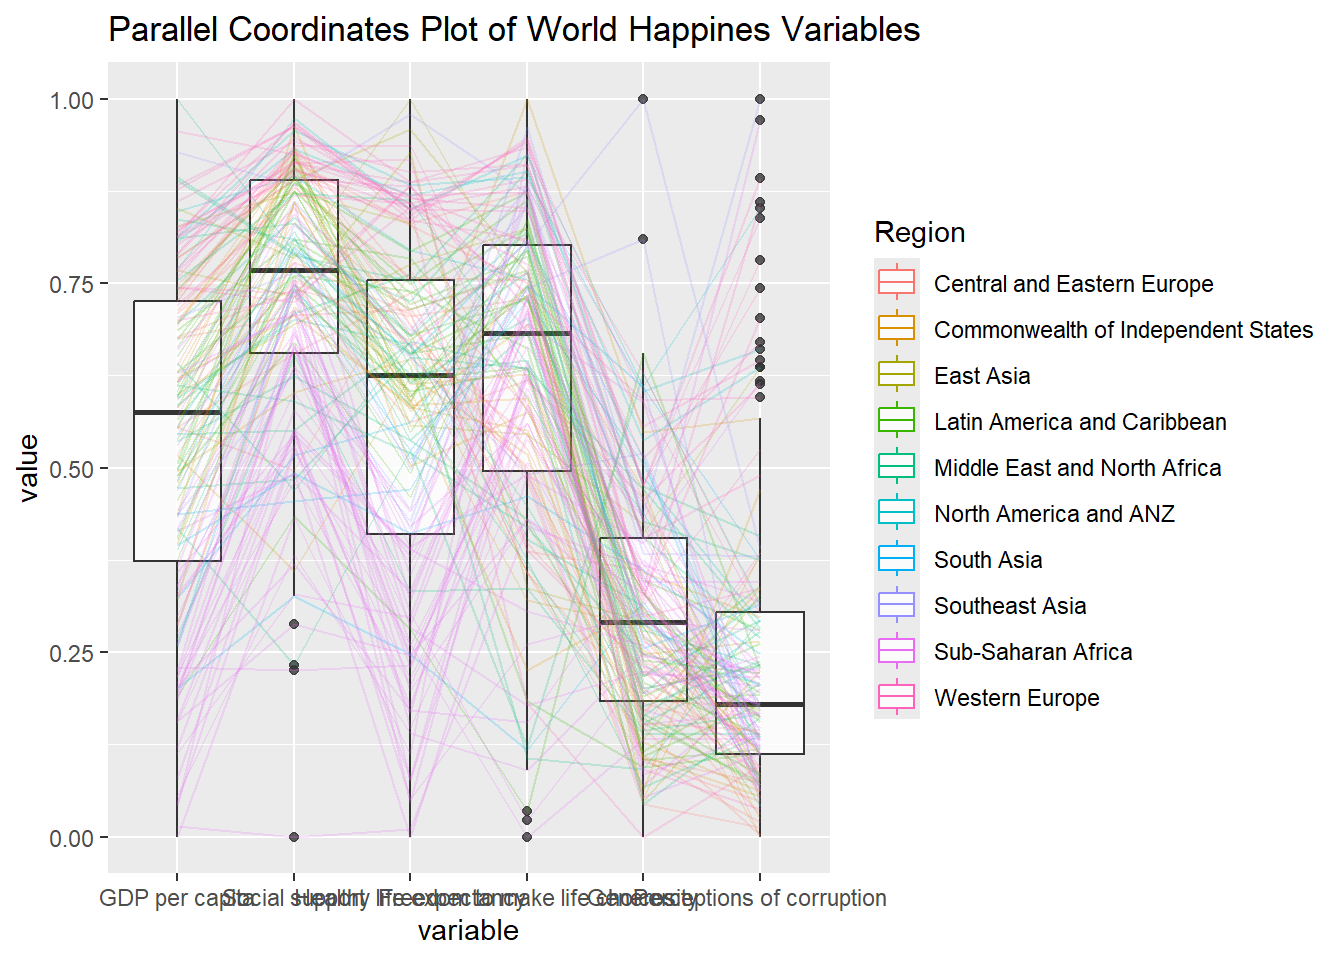
ggparcoord(data = wh,
           columns = c(7:12),
           groupColumn = 2,
           scale = "uniminmax",
           alphaLines = 0.2,
           boxplot = TRUE,
           title = "Multiple Parallel Coordinates Plots of World Happines Variables by Region") +
  facet_wrap(~ Region)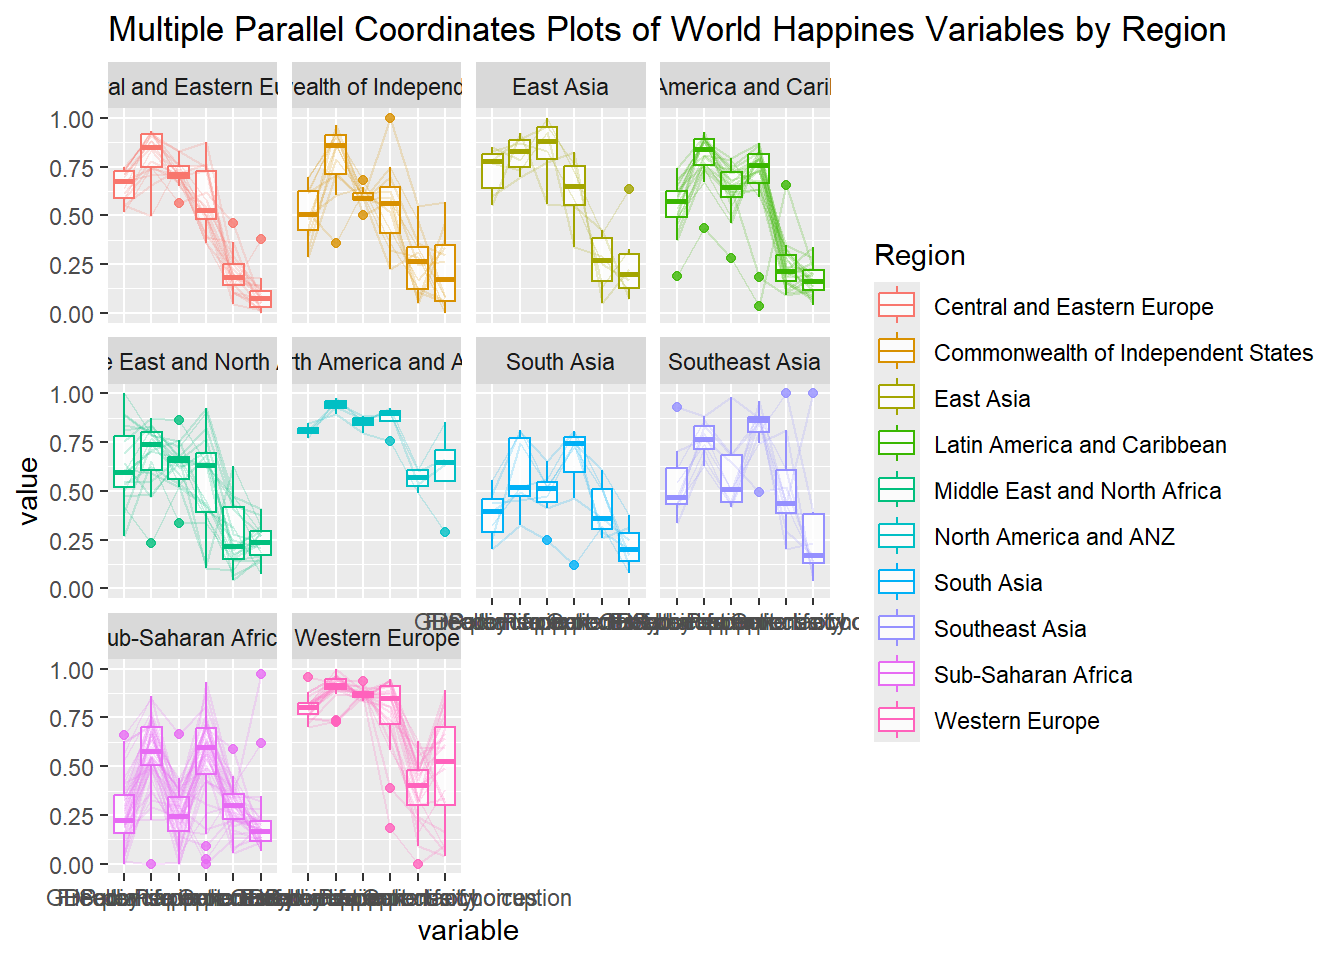
histoVisibility <- rep(TRUE, ncol(wh))
parallelPlot(wh,
             rotateTitle = TRUE,
             histoVisibility = histoVisibility)